
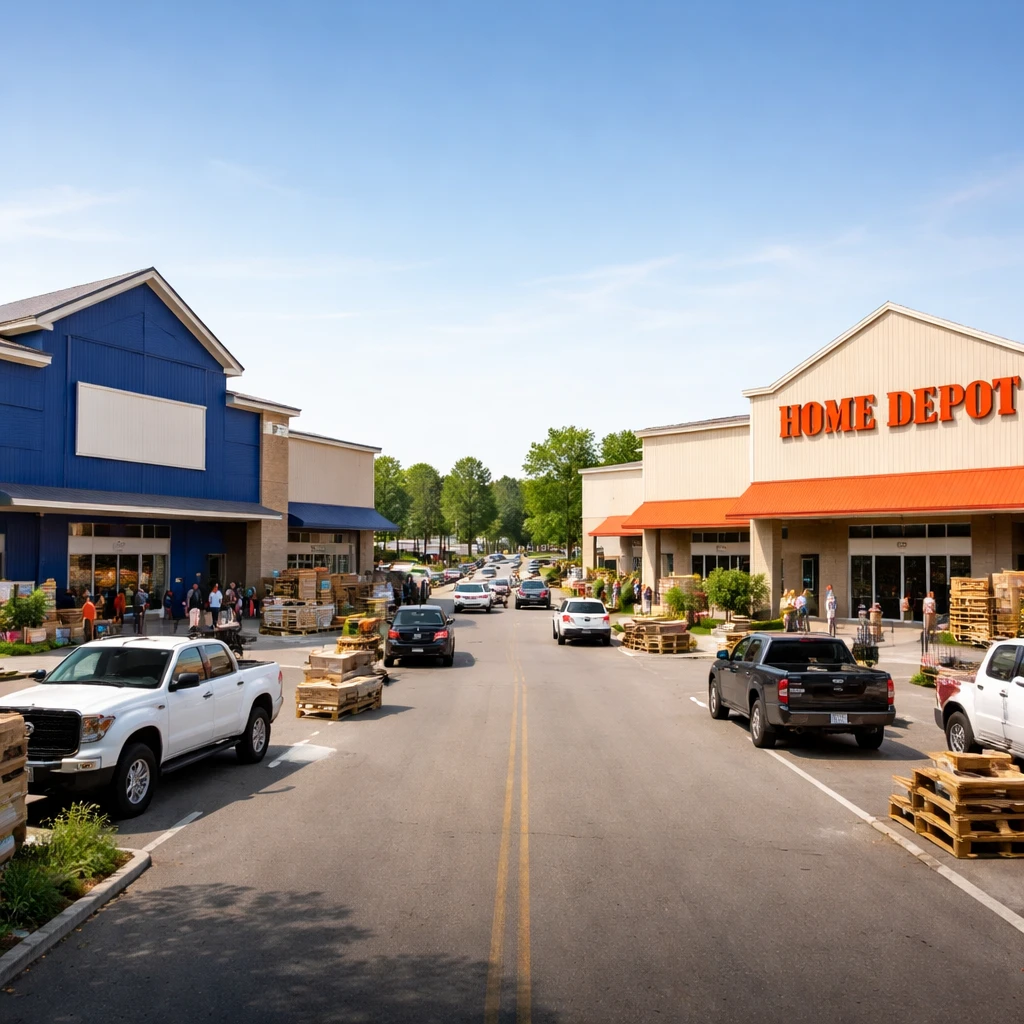
Investors comparing the two largest U.S. home improvement retailers are choosing between a valuation-driven rebound case at Lowe’s and a stronger near-term operating performance at Home Depot.
Valuation and financials: Lowe’s
Lowe’s looks relatively cheap on a headline multiple, trading at a price-to-earnings ratio of 17.0x as of Jul 31, 2026. The stock price was $200.80, down 25.36% over the prior 12 months, as of Sep 8, 2026 at 3:59 PM EDT. Fundamental measures show revenue recovered to $86.29 billion for the fiscal year ended Jan 30, 2026, from $83.67 billion the year prior, and levered free cash flow remained resilient at $7.65 billion as of Jan 31, 2026.
On a fair-value basis, Lowe’s was assigned $183.61, implying -8.6% upside as of Sep 9, 2026 at 5:45 AM EDT. That gap between market price and fair value underpins the argument that Lowe’s could see a sentiment-driven rebound if housing turnover, remodeling demand, or interest rates become more favorable. However, the company recently trimmed guidance to the low end of its range and reported comparable sales that missed expectations, a reminder that near-term operating progress is mixed. Read more — Aug 18, 2026.
Operating momentum: Home Depot
Home Depot currently shows stronger top-line momentum. The company recorded 1.7% comparable-sales growth in Q2 2026, versus Lowe’s 0.2%. Home Depot’s revenue reached $164.68 billion, as of Feb 1, 2026. Its trailing P/E was higher at 22.0x as of Jul 31, 2026, and the fair value estimate was $280.01, implying -10.7% upside as of Sep 9, 2026 at 5:45 AM EDT.
Free cash flow at Home Depot declined to $12.65 billion for the fiscal year ended Jan 31, 2026, down from $16.32 billion in the prior fiscal year ended Jan 31, 2025. Despite that drop in FCF, Home Depot maintained its fiscal 2026 comparable-sales guidance and rolled out three-hour delivery nationwide to better serve professional customers and to capture urgent project purchases. Read more — Aug 17, 2026.
Direct comparison
| Lowe’s Companies Inc (LOW) | Home Depot Inc (HD) | |
|---|---|---|
| 1-year performance | -25.36% | -24.47% |
| P/E | 17.0x | 22.0x |
| Latest comparable sales | 0.2% | 1.7% |
| Fair-value upside | -8.6% | -10.7% |
| Latest gross margin | 33.5% | 33.3% |
All market prices are as of Sep 8, 2026 at 3:59 PM EDT. Fundamental values use the dates shown above.
Assessment
Lowe’s offers a cleaner valuation setup for a rebound thanks to its lower multiple and reduced expectations; modest signs of sales stabilization could have outsized effects on its valuation. Home Depot, however, holds the stronger operating hand right now, driven by better comparable-sales growth and initiatives that support professional customers and urgent purchases.
The principal downside for Lowe’s is that its apparent cheapness could reflect a more protracted recovery in demand than the market expects. The principal upside is that even modest improvement in sales could matter more for Lowe’s valuation than for Home Depot’s, given Lowe’s lower earnings multiple and the gap between price and fair value.
Historical data is limited to 10 years on Pro+ plan.