
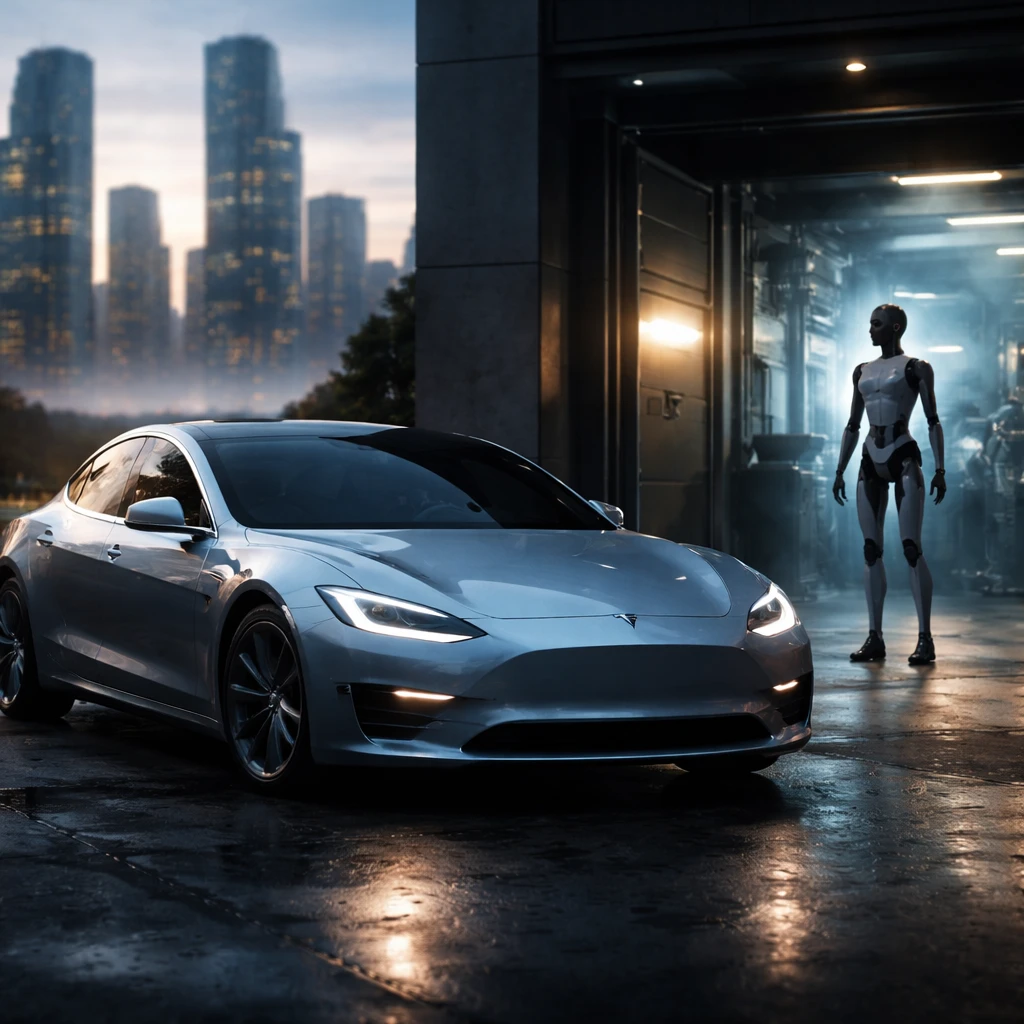
Tesla delivered a Q2 report that split the market's reaction: revenue outpaced estimates by $2.7 billion, yet earnings per share missed by 33% - $0.33 reported versus $0.49 expected. The result pushed the stock down -7.6% in pre-market trading to $345.47 from a close of $374.01, translating into an effective trailing P/E of 363.7x for a carmaker with 2.3% revenue growth and a 4.2% return on invested capital (ROIC).
The dichotomy at the heart of investors' debate is clear: Tesla continues to trade like a high-growth robotics/AI platform while many of the metrics tied to its automotive business are decelerating.
Quarterly trade-offs and margin pressure
Several profitability indicators deteriorated quarter over quarter. Automotive gross margin excluding regulatory credits fell to 16.3% from 19.2% in Q1. Net income margin, which once peaked at 15.5%, has compressed to 4.0% on a last-twelve-months basis. EPS has experienced a pronounced decline, dropping from $3.62 to a projected $1.08 for the current fiscal year.
Barclays captured the tension succinctly in its post-earnings note: "The 2Q result reminded us that progress isn’t linear, yet spend must inflect higher." That line underscores the trade-off management faces between near-term profitability and increased investment in future platforms.
What the earnings call disclosed about future initiatives
Management framed the Optimus humanoid program as a long-duration effort, suggesting production will follow a "flat S-curve initially" as the company builds an entirely new supply chain. Initial Fremont production targets are set for late July/August, but the more ambitious volume trajectories remain multi-year prospects: Gen 3 is described as roughly 1 million units per year, while Gen 4 is an aspirational 10 million units per year.
Outside of humanoids, Tesla highlighted robotaxi progress as a nearer-term operational signal. The company reported 380,000 unsupervised miles across six cities, with miles driven growing 10% week-over-week. Notably, Orlando and Tampa launched one day before the earnings release.
However, independent forecasts cited during the call paint a more conservative picture for humanoid adoption. Bank of America is referenced as projecting only 1.2 million global humanoid shipments industry-wide by 2030.
Capital plan and balance sheet implications
Tesla signaled a marked escalation in capital intensity. The company expects to spend more than $25 billion in capital expenditures in 2026 and is arranging debt facilities of up to $30 billion. Management tied these commitments to Robotaxi development, Optimus, semiconductor fabs (including a Terafab with SpaceX), solar manufacturing, and AI infrastructure.
That scale of investment represents a significant shift for a company generating approximately $7.0 billion in levered free cash flow. The prospect of expanded debt and multi-year capex needs sits alongside speculation about a potential SpaceX merger referenced during market commentary, which some market participants view as a governance wildcard.
Valuation snapshot
The current valuation profile is stark on several metrics:
- P/E LTM: 363.7x, reflecting the collapse in EPS from $3.62 to an expected $1.08.
- Forward P/E (FY+1): 193.1x, based on a consensus EPS estimate of $1.94.
- Forward P/E (FY+2): about 140x, based on a consensus EPS estimate of $2.47.
- Fair value (InvestingPro): $267.63 - implying -28.4% downside to the current price.
- Analyst consensus target: approximately $460 (Bank of America) - implying +23.1% upside on consensus estimates.
- Revenue growth (LTM): 2.3% - effectively near stagnation.
- ROIC: 4.2% - below many estimates of the company's cost of capital and indicative of economic value destruction on deployed capital.
Citizens’ initiation, labeled Market Perform, summarized the core issue: "near-term market expectations are too optimistic given the complexity of bringing Optimus to market... Tesla is at the beginning of an Optimus investment cycle" - a characterization that emphasizes higher spending now rather than immediate earning.
Technical picture and near-term levels to watch
Technical indicators across short- and medium-term timeframes skew bearish. On timeframes from one minute to one week, signals read Strong Sell; the monthly chart remains the sole Buy signal, suggesting only the longest-term structural case retains supportive momentum.
Key technical levels noted in the pre-market action include:
- Daily S1 support: $371.25 - already breached in pre-market trading.
- Weekly S2 support: $358.85 - an important floor if selling accelerates.
- RSI (daily): 41.7 - not yet in oversold territory, implying further downside is possible.
- MACD: -9.22 - continuing to deteriorate with no clear momentum reversal.
With the pre-market price at $345.47, the stock was already testing toward the weekly S2 support and well below the daily S1 level. The monthly Buy signal remains the only technical buffer against a continuation of the decline.
Bull and bear frameworks
The bull case centers on successful execution of several growth vectors: sustained 10% week-over-week expansion in robotaxi miles, imminent Optimus production ramp at Fremont, and the potential for a multibillion-dollar capex cycle to establish a large physical AI enterprise. Under that scenario, some analysts, such as those reflected in the consensus, assign material upside.
The bear case focuses on current fundamentals: the company is trading at a $1.40 trillion market capitalization while facing compressed margins, a shallow revenue growth profile, and sharply higher capital needs. Using the fair value model that the market referenced, the shares would be about 28% overvalued before any premium for humanoids. With an ROIC of 4.2%, Tesla is, by that metric, destroying economic value on its invested capital. A potential $30 billion debt facility and the planned surge in capex would weigh on free cash flow for years, and the "flat S-curve initially" language from management signals that Optimus is unlikely to deliver near-term financial benefits.
The market's central dilemma is straightforward: current cash flows from the automotive business are being asked to finance an aggressive pivot into robotaxi, humanoid robotics and semiconductor manufacturing, while those cash flows show signs of contraction.
Takeaway
Tesla's Q2 showed a company at an inflection point in which valuation reflects future platform potential even as core automotive metrics weaken. Investors and analysts now must weigh the timeline and probability of ambitious technological and manufacturing rollouts against an intensifying capital and margin burden in the near term.