
U.S. consumer prices rose 3.5% year-on-year in June 2026, down from 4.2% in May. That deceleration has been highlighted by political leaders, but the headline rate understates the lived reality for households: the consumer price index now stands roughly 28.5% above its 2020 base, meaning everyday goods and services cost nearly a third more than six years ago regardless of the recent slowdown in the pace of increases.
The distinction between the pace of inflation and the accumulated price level is central to understanding the disconnect between official messaging and household finances. Wages measured from the same 2020 baseline have climbed approximately 27% in nominal terms, according to Washington Post reporting published July 15, leaving a spread of only about 150 basis points versus the 28.5% cumulative rise in consumer prices. That gap does not represent a dramatic decline in living standards, nor does it indicate material income gains - it simply means households, on average, have kept pace rather than gotten ahead. A worker who earned $50,000 in 2020 and now makes $63,500 has not recovered purchasing power beyond that point; the increase has barely matched the higher cost of living. Framing the slowing rate as an unequivocal victory elides this important difference between rate and level.
The official CPI calculations also struggle to capture ways in which the cost burden has increased without appearing in the published numbers. Two industry practices in particular - shrinkflation, where package sizes fall while prices remain unchanged, and skimpflation, where apparent size and price stability hides reductions in product quality - amplify consumer pain in ways the Bureau of Labor Statistics methodology is structurally limited in recording. Because the CPI tracks price per unit rather than effective quantity or quality, a product that is sold at the same sticker price but in a smaller package effectively rises in cost to the buyer without a commensurate movement in the index.
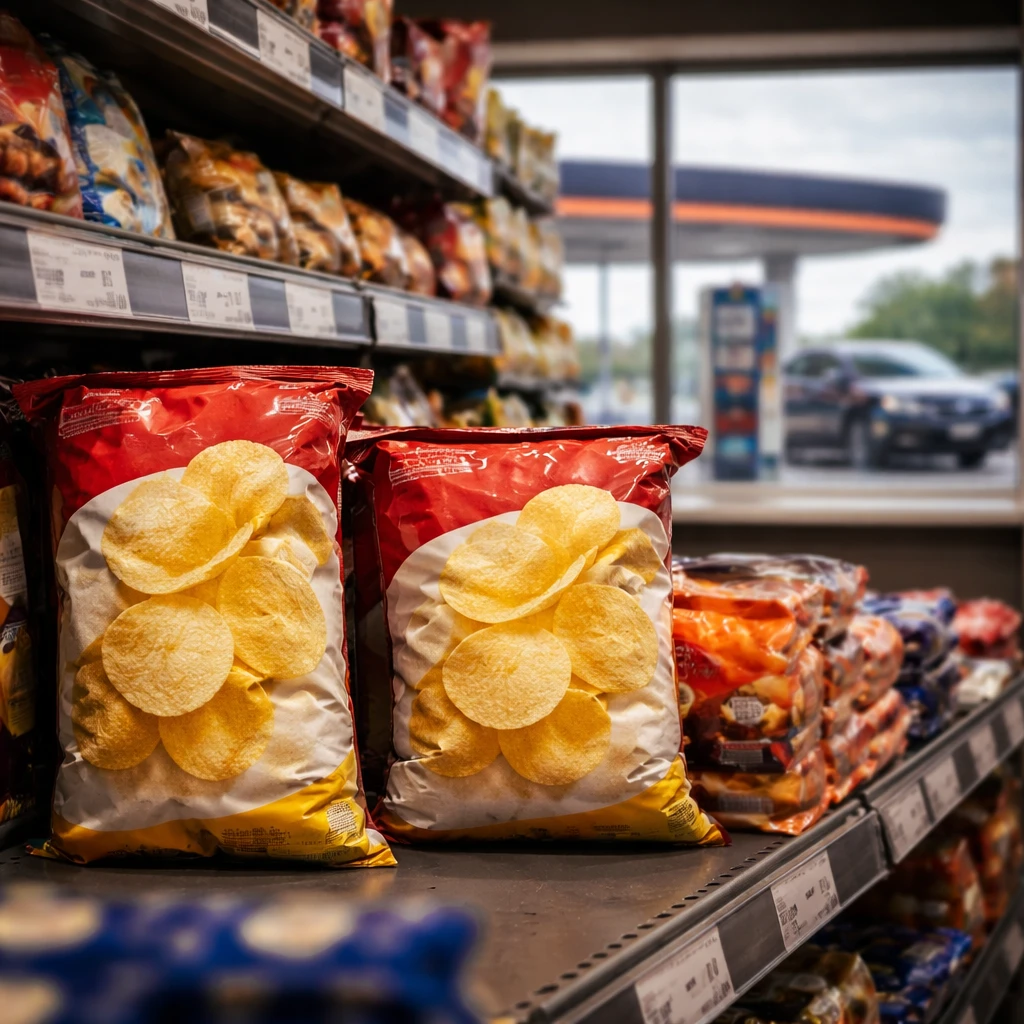
A tangible example cited in the data set: Doritos Nacho Cheese party-size bags shrank from 9.75 ounces to 9.25 ounces while the retail price remained $5.79. That reduction equates to roughly a 5.4% effective price increase per ounce even though the unit-price tracking approach used in CPI tables would not necessarily register the change. New research published in the Journal of Consumer Research, referenced by The Cooldown on July 15, indicates consumers perceive quality reductions as less fair than explicit price increases or size cuts, and are less inclined to repurchase products that have been stealthily downgraded. That combination implies a form of hidden inflation that hits household budgets and brand loyalty even when it remains invisible in headline statistics.
Within the June release, grocery inflation was a notable contributor. Grocery costs rose 0.2% for the month, with eggs jumping 4.3%, dairy increasing 1.2%, and fruits and vegetables up 5.3% year-on-year, according to Reuters reporting on July 14. These categories disproportionately weigh on lower- and middle-income households, meaning the aggregate CPI number can understate the targeted pressure felt by those segments.
Wage dynamics provide additional context. Average hourly earnings have increased just 27 cents in real terms since the current administration took office, while the 3.5% nominal wage gain over the past year matched the 3.5% CPI rise. On that basis, workers experienced no net real-term improvement in purchasing power over the prior 12 months, and the prevalence of shrinkflation and skimpflation suggests even those headline-neutral moves may overstate how much consumers can buy with their paychecks.
The apparent improvement in June is also rooted in volatile energy prices rather than broad-based disinflation. The month-over-month slowdown was driven almost entirely by a 5.7% drop in energy costs tied to a short-lived Iran ceasefire that subsequently broke down. By July 14 gasoline was already moving higher, with the national average reaching $3.86 per gallon, according to Herald/Review Media. That rapid reversal in fuel costs highlights how transient geopolitical developments can temporarily depress the headline number while leaving underlying pressures intact.
Market and policy reactions reflect that fragility. BMO Capital Markets chief U.S. economist Scott Anderson told Reuters: "Energy prices plunged on the Iran cease-fire and memorandum of understanding. But with fighting back on in the Gulf, the MOU in tatters, and energy prices heading higher again in July, the balance of risks remains more heavily weighted toward a rate hike at some point this year." Fifth Third Commercial Bank's chief U.S. economist Bill Adams summarized the near-term outlook by saying: "The outlook for inflation in July is less promising." Those views point to an elevated probability that the mid-year easing proves ephemeral.
Federal Reserve Chair Kevin Warsh offered a similarly cautious reading when he testified before Congress, stating bluntly that "prices are too high" and signaling the central bank has "no tolerance for persistently elevated inflation," according to Spectrum News. But that hawkish posture is founded on the same BLS data that struggles to reflect shrinkflation and skimpflation. If the true burden of price and quality shifts is meaningfully larger than the CPI suggests, the Fed's policy calibration risks underestimating the consumer squeeze without a clear mechanism to detect the divergence.
Financial markets are pricing roughly a 60% probability of a rate hike in September, and the late-July Federal Open Market Committee meeting is not expected to change that view based on a single month of energy-driven deceleration. For fixed-income investors, the roughly 60% likelihood of a September hike argues for keeping duration short until the July CPI print is released and clarifies whether the energy rebound has meaningfully re-entered the inflation data.
The next pivotal data point is the July CPI report, due in mid-August. Should the rebound in energy prices tied to renewed conflict in the Gulf push pump prices and utility bills higher as analysts anticipate, the June deceleration will likely be reframed as a one-month reprieve rather than the start of a durable trend. For households already absorbing six years of cumulative price increases, a 150-basis-point nominal wage advantage over the 28.5% cumulative CPI rise is scant consolation. And when hidden reductions in package size or product quality are factored in, even that slight margin of nominal wage outperformance may be narrower than the headline numbers imply.
Summary
- The June 2026 CPI slowed to a 3.5% year-on-year pace, down from 4.2% in May, but the index remains roughly 28.5% above 2020 levels.
- Nominal wages indexed to 2020 are up about 27%, producing only a 150 basis-point gap against cumulative price increases and leaving purchasing power largely unrecovered.
- Shrinkflation and skimpflation create hidden inflation that CPI methodology is poorly equipped to capture, and volatile energy prices tied to geopolitical events drove much of June's cooling.
Key points
- Consumers face nearly a third higher prices versus 2020 despite a slowing annual inflation rate - persistent price-level effects matter for living standards. (Impacted sectors: consumer staples, grocery, transportation)
- Wage growth has broadly kept pace with headline inflation but has not produced real purchasing-power gains; measured wage gains are slim versus cumulative price increases. (Impacted sectors: labor-sensitive services, retail)
- Energy price volatility related to geopolitical developments can temporarily distort monthly CPI readings, complicating policy and investment decisions. (Impacted sectors: energy, fixed income)
Risks and uncertainties
- Energy price rebound risk - renewed fighting in the Gulf could push energy costs higher again and erase the June slowdown, influencing headline inflation and rate decisions. (Impacted: energy, transportation, utilities)
- Measurement gap from shrinkflation and skimpflation - hidden reductions in quantity and quality may understate the true rise in consumer costs and affect brand loyalty and retail demand. (Impacted: consumer staples, packaged foods, retail)
- Policy miscalibration risk - if CPI understates consumer cost pressures, monetary policy decisions based on those figures may not fully address the erosion of household purchasing power. (Impacted: financial markets, fixed income)