
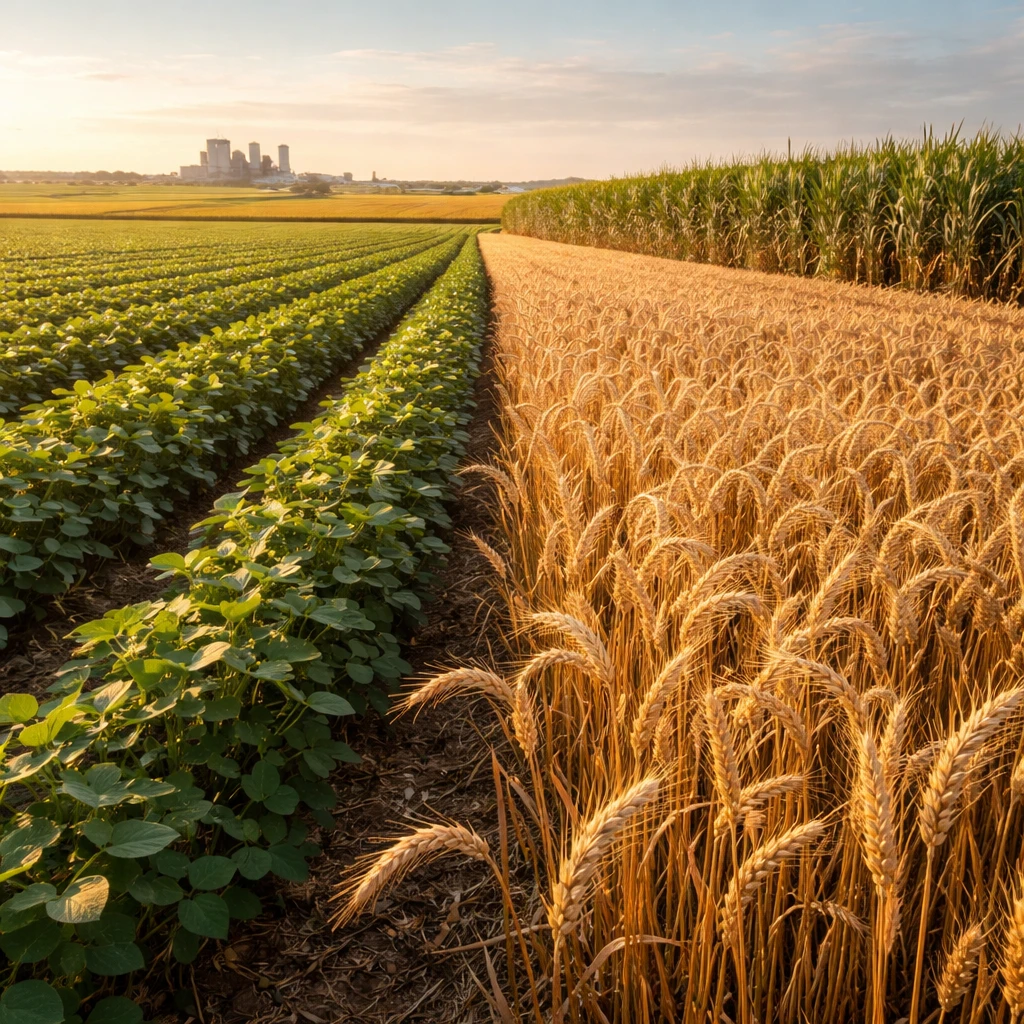
OptionMetrics research director Brett Friedman drew attention to a quiet outperformance among several agricultural commodities in 2026, noting that sugar, Chicago SRW wheat and soybeans have posted notable gains with strong risk-adjusted returns. Energy markets have drawn the bulk of media and market focus this year, Friedman said, but the three crops have advanced with comparatively little public fanfare.
Friedman highlighted the scale of the moves in dollar terms and on a risk-adjusted basis. Year-to-date through Oct. 16, cumulative performance stands at +44.7% for sugar, +32.3% for Chicago SRW wheat and +22.1% for soybeans. For context on broader equity returns over the same period, the SPDR S&P 500 ETF (SPY) returned 11.7% and the Invesco QQQ Trust (QQQ) returned 15.8% as of Oct. 16.
When accounting for volatility, the three crops' Sharpe ratios are especially notable, Friedman wrote. Sugar's Sharpe ratio is reported at +1.72%, soybeans at +1.3% and Chicago SRW wheat at +1.2%, reflecting returns relative to realized volatility over the period.
Wheat and soybeans in particular have moved closely this year. Friedman noted their calendar-year price correlation reached a record 0.919, implying that roughly 85% of price movement in one crop can be explained by movement in the other. That near-lockstep behavior reduces diversification benefits between the two, although both continue to display their customary seasonal patterns in implied volatility.
By contrast, copper has been prominent in coverage because market participants often view it as an AI proxy given its role as an input for electronics. Friedman observed that investors trading copper on that thematic have, so far, been disappointed.
Copper's year-to-date return is 15.5%, but its Sharpe ratio of 0.65 trails the Sharpe ratios reported for sugar, soybeans and wheat. In addition, copper's average implied volatility this year is 29.1%, which remains above its 21-year baseline of 26.9%.
Friedman emphasized the distinction between narrative and risk-adjusted performance, writing that "the financial press often confuses a compelling narrative with actual, risk-adjusted results." He also noted the prominence of energy markets in 2026, while underscoring that these agricultural commodities hold meaningful weights in the S&P GSCI and the Bloomberg Commodity Index.
Summary of data points cited:
- Sugar year-to-date cumulative performance: +44.7%
- Chicago SRW wheat year-to-date cumulative performance: +32.3%
- Soybeans year-to-date cumulative performance: +22.1%
- SPY year-to-date return (as of Oct. 16): 11.7%
- QQQ year-to-date return (as of Oct. 16): 15.8%
- Sharpe ratios: sugar +1.72%, soybeans +1.3%, Chicago SRW wheat +1.2%, copper 0.65
- Copper year-to-date return: 15.5%
- Copper average implied volatility this year: 29.1% (21-year baseline: 26.9%)
- Wheat-soybeans calendar-year price correlation: 0.919 (approx. 85% shared movement)
The comparisons underscore that strong headline returns do not automatically translate into superior risk-adjusted performance, and that less-covered commodities can deliver outsized results relative to major market narratives.