Hook + thesis
FUCHS SE's US-listed OTC line, FUPEF, reads like a story of inertia: years without a decisive breakout and now a recent spike that looks technically unsustainable. Momentum indicators are screaming overbought even as liquidity is almost non-existent. That combination is a recipe for fast, volatile moves; for disciplined traders who respect position sizing, a mid-term short makes sense.
The thesis is simple: extreme technical overbought readings increase the odds of a corrective move back toward the multi-month averages, and with average daily volume effectively zero in many reporting periods, price gaps can be sharp in either direction. I'm proposing a limited-size short with a clearly defined stop and target to capture mean reversion while acknowledging the asymmetric short-squeeze risk.
What the company does and why the market should care
FUCHS SE is listed OTC as FUPEF. On the public US line there is little market transparency and virtually no continuous trading volume. For investors and traders, the relevant features are structural rather than operational: the stock’s liquidity profile and public-market price action. That matters because even modest order flow can move the price substantially when average daily volume is zero or near-zero for many settlement periods.
Technical and market evidence
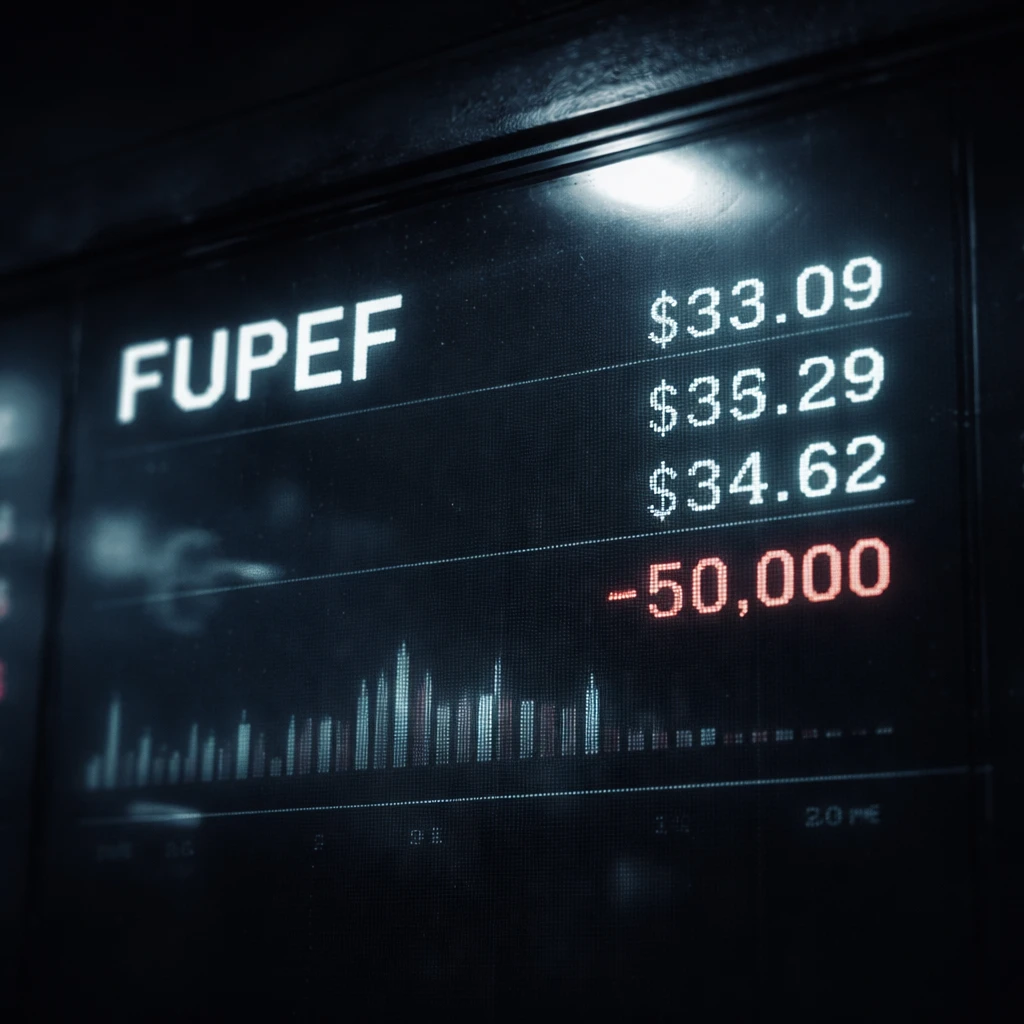
- Price momentum is stretched: the 9-day exponential moving average sits at $34.29, while the 10/20/50 simple moving averages cluster tightly at $33.62, $33.29, and $33.09 respectively - indicating a recent push above the multi-week trading band.
- RSI is effectively maxed out at ~100, which is a textbook sign of extreme overbought conditions and typically precedes pullbacks or consolidation phases rather than sustained exponential gains.
- MACD shows bullish momentum - MACD line 0.5297 vs. signal 0.1059 and a positive histogram 0.4237 - suggesting the recent advance has upside steam for now, but MACD alone does not preclude a sharp reversion when RSI is this overheated.
- Short interest has been rising: 3,519 shares short as of 03/31/2026 (with reported days-to-cover figures often at or near 999.99 because average daily volume is zero). Earlier checkpoints show 3,382 on 03/13/2026 and 1,920 on 11/14/2025 - a clear lift in short exposure over recent quarters.
- Reported short-volume episodes are negligible: a single short-volume record on 05/08/2025 showed total volume 1 and short volume 1, reinforcing the reality that public liquidity is functionally nil.
Why this matters for a trade
When a ticker trades with effectively no daily volume, technical indicators become amplified: a single sizable order can push the price past commonly watched moving averages and trigger cascades. An overstretched RSI near 100 and tight SMA clustering suggests recent buying was concentrated and not broad-based. That creates a favorable environment for mean reversion back toward the $33 area or lower if sellers step in.
Valuation framing
There is limited public valuation data for the US-listed line. The OTC listing implies reduced institutional coverage, thin trading, and an opaque market cap profile, so strict peer multiple comparisons are not meaningful here. Instead, treat valuation qualitatively: the stock's price action suggests speculative positioning rather than valuation-driven accumulation. With moving averages clustered near the low-$30s and the short-term EMA near $34.29, a rational reversion target is back to the SMA band around $33 or to a lower consolidation around $30 if momentum reverses sharply.
Catalysts (2-5)
- Momentum unwind - a single block sale or withdrawal of speculative bids could flip the overbought structure and send price toward the 50-day SMA around $33.09.
- Quarterly or corporate announcement - any unexpected corporate update that reduces bullish sentiment could accelerate a sell-off in this thin market.
- Macro risk-off - in an environment where risk assets are repriced lower, illiquid OTC names are often hit harder because there are fewer committed buyers.
- Short-covering rallies - paradoxically a catalyst for further volatility: if short-covering spikes, price can gap higher, increasing short-term risk for shorts before the expected mean reversion occurs.
Trade plan - actionable and precise
Trade direction: Short.
Entry: Initiate a short position at $34.50.
Stop loss: Hard stop at $37.00 - a clear invalidation if price breaks decisively above the recent EMA and sustains higher levels.
Target: Cover at $30.00 for the primary objective, with a conservative partial-cover at $33.00 to lock in gains if price returns to the 10-50 day SMA band.
Position sizing: Keep size small - this is a high-risk trade because of severe illiquidity. Limit exposure to a fraction of typical risk capital appropriate for OTC names.
Horizon: Mid term (45 trading days). Expect mean reversion to play out over several weeks as overbought conditions normalize and liquidity re-enters at lower levels. If price grinds lower slowly, stick to the target band; if a sharp gap lower occurs early, consider scaling exits to preserve gains.
Why these levels?
The $34.50 entry is chosen just above the 9-day EMA to allow for a reasonable short entry while the MACD still reads bullish - meaning you're entering as momentum appears ripe to roll over. The $37.00 stop accommodates short-lived spikes and the potential for squeeze-driven overextension; it also preserves a defined risk. The $30.00 target anchors on the idea of a larger mean reversion to below the recent SMA cluster and establishes a favorable reward-to-risk if the thesis plays out.
Risks and counterarguments
- Severe illiquidity and squeeze risk: Average daily volume is often reported as zero in many settlement periods, and short interest has been rising. A sudden short-covering wave could send the price sharply higher and blow through stops - this is the primary operational risk for shorts.
- Positive momentum may persist: MACD is bullish and short-term EMAs are above SMAs - momentum can remain extended for longer than expected, especially in low-float situations where a few buyers can sustain a rally.
- News or corporate action: Any unexpected announcement that tightens supply or attracts buyers could invalidate the technical reversion thesis and cause a sharp re-rating higher.
- Execution slippage: Given the near-zero reported volumes, fills may be difficult, and bid/ask spreads will likely be wide. This increases realized risk and can turn a seemingly sound stop into a much larger loss in practice.
- Counterargument: The rising short interest and current bullish MACD may indicate that informed players expect further upside or are positioning for a squeeze. In that case, the trade could become a value trap for shorts unless clearly defined stops and tight sizing are employed.
What would change my mind
I would abandon the short and flip bias if price sustains above $37.00 on expanding reported volume and MACD continues to accelerate higher while RSI remains elevated. A confirmed breakout above the recent EMA/SMA cluster with confirmed liquidity would suggest the rally is not speculative ripples but a structural re-rating, and my view would shift to neutral-to-bullish.
Conclusion
FUPEF is a textbook thin-OTC setup where technical overstretch and opaque liquidity intersect. The trade is high-risk, but the asymmetry is meaningful if you enter small, use a tight stop, and target a mean reversion back toward the low-$30s or $30.00. Respect the elevated short-squeeze and execution risks - this is not a position for size-insensitive accounts. With strict risk controls, the mid-term short offers a disciplined way to exploit an overbought, illiquid market structure.