
Latest update: Oct 12, 2026, 07:11 AM UTC
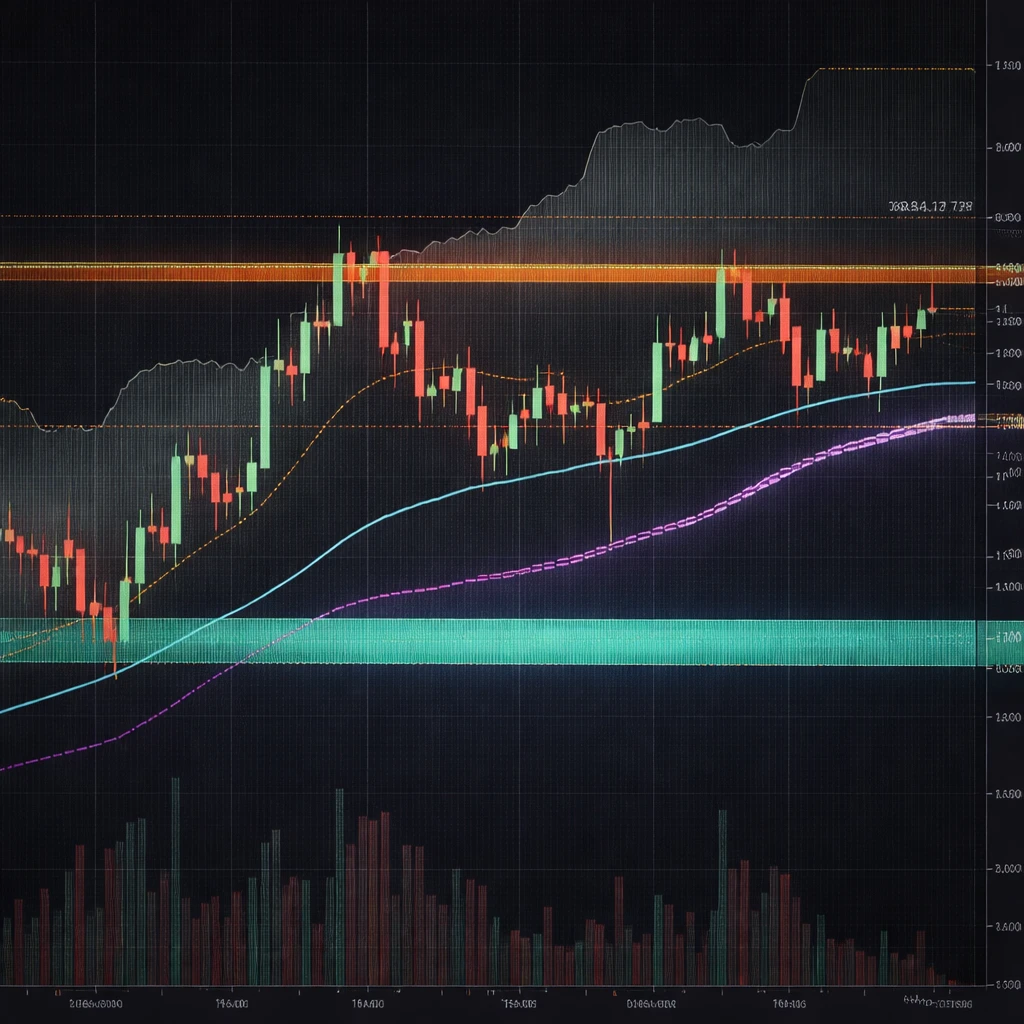
Bitcoin is currently pinned at $84,175 on the 5-hour timeframe, trading in a narrow band between clearly defined support and resistance. The immediate support level sits at $83,987 - a VWAP-derived floor - while dynamic resistance is set at $84,643 by the SuperTrend indicator. Price action is forming inside what many traders would call a no-trade zone, with the next decisive moves contingent on a confirmed breakout above $84,650 or a breakdown below $83,800.
Price Squeeze and Technical Context
The 5-hour chart captures a tug-of-war between buyers and sellers. The most recent candle shows the pair hovering just above the 50-period simple moving average, signalling that short-term momentum favors buyers but without clear trend conviction. The pattern is one of consolidation, which the analysis estimates to be roughly 80% complete, compressing volatility and setting the market up for either a breakout or a downside resolution.
Key Technical Levels
- Support: $83,280 to $83,987 - a confluence of the Ichimoku Cloud and VWAP.
- Additional support: $82,800 - identified as the trendline and Cloud bottom, a level that has produced three prior bounces.
- Resistance: $84,643 - SuperTrend dynamic resistance that may act as a bull trap.
- Resistance above: $84,716 - the 61.8% Fibonacci retracement.
- Invalidation point for a bear case: $84,750.
Momentum and Volatility
Momentum indicators present a mixed picture. The MACD has produced a bullish crossover, which tilts short-term momentum in favour of buyers. However, the ADX is low at 18.88, indicating a weak trend and an elevated likelihood of mean reversion rather than a sustained directional move. Average True Range registers at 676.88 (approximately 0.8%), implying moderate expected volatility in the near term.
Practical Bull and Bear Playbooks
Trading plans laid out for both sides maintain symmetry. On the bullish side, more aggressive entries are suggested at $84,250 with conservative entries around $84,750. Protective stops and target structures are specified:
- Bullish - Entry: $84,250 (Aggressive) / $84,750 (Conservative); Stop: $83,734.5; Targets: $86,273, $87,363, $89,000; Risk/reward: 1.5-4.2 (Aggressive) / higher (Conservative).
- Bearish - Entry: $83,800 (Aggressive) / $82,800 (Conservative); Stop: $83,815.5; Targets: $81,277, $80,433, $77,781; Risk/reward: 1.5-4.9 (Aggressive) / higher (Conservative).
Trade management guidance aligns with these setups: if Target 1 is reached, move stops to breakeven. If the position reaches Target 2 or beyond, consider trailing using ATR or the 20-period SMA to protect gains.
Indicator Primer
- SuperTrend: An adaptive trend indicator that currently sits overhead as resistance - price below the line signals a downtrend, above signals an uptrend.
- Ichimoku Cloud: Serves as a dynamic zone of support and resistance; the listed support range reflects this cloud interaction.
- VWAP: A volume-weighted benchmark often watched by institutional participants; holding above it can attract trend followers.
- SMA50/SMA200: Benchmarks for medium and longer-term trend; the present price is just above the SMA50.
- MACD crossover: Indicates a shift toward buyer control, though the weak ADX tempers conviction.
Risk Management and Practical Lesson
When price compresses between robust support and resistance after a multi-week advance, false breakouts become common. The area around SuperTrend resistance is flagged as a potential "bull trap". Given the compressed range and mixed momentum readings, confirmation from clean candle closes and volume is emphasized over chasing impulsive wicks. The recommended approach is to wait for confirmations above $84,650 for a bullish resolution or below $83,800 for a bearish resolution before committing significant size.
Disclosure: This article was generated with the support of AI and reviewed by an editor. For more information see our T&C.