
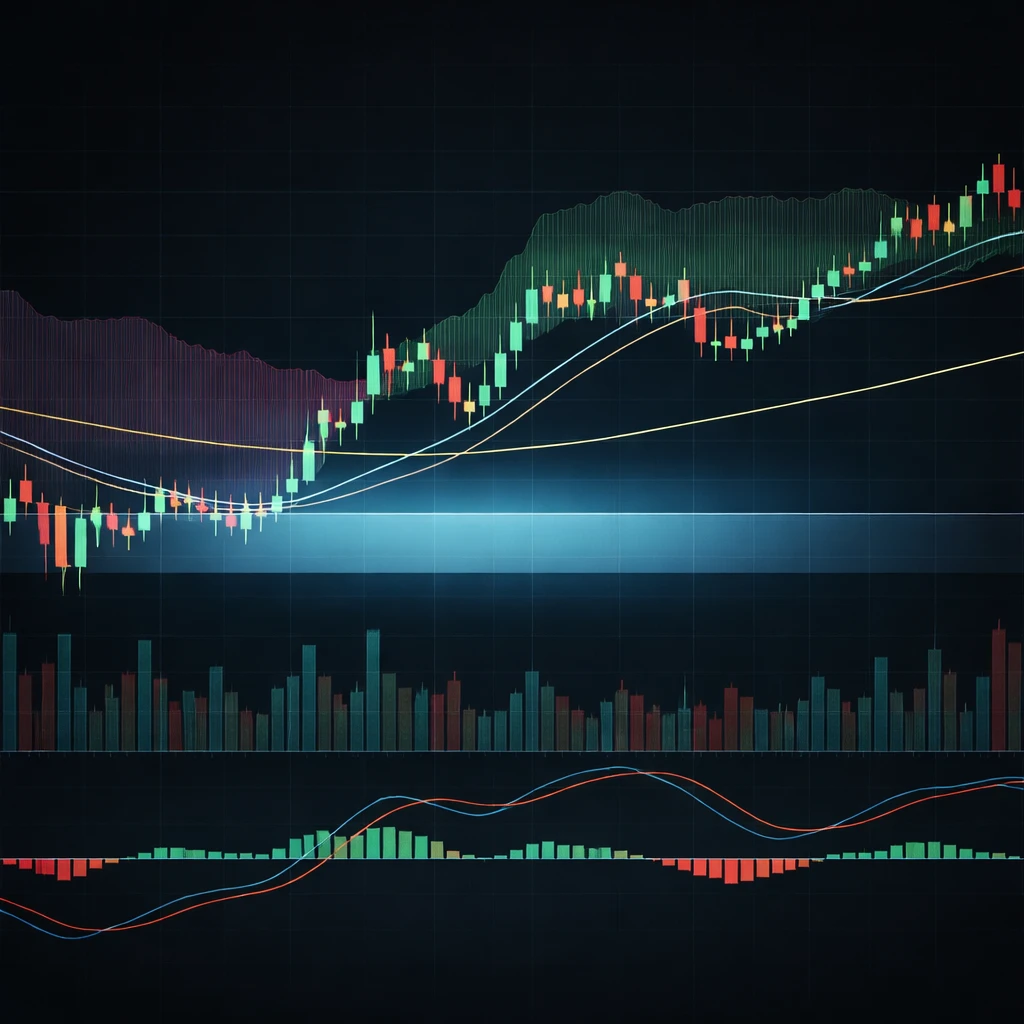
SanDisk's short-term price action is concentrated at a technical crossroads. At $1,414.54 on the 5-hour chart, the stock is trapped between a set of overhead barriers and nascent bullish indicators. The coming moves - whether a breakout north of $1,525 or a slide toward $1,280 - are likely to establish the dominant trend for the coming weeks.
Price versus trend
The immediate resistance cluster includes the 200-period simple moving average at $1,421.28, a SuperTrend reading at $1,412.72, and the top of the Ichimoku cloud at $1,525.59. Short-term momentum shows bullish signs, with a MACD bullish crossover and price trading above the 20-period SMA, but the medium- and longer-term structure remains constrained by those overhead levels.
Why this matters
These technical layers are where bullish and bearish convictions will collide. A clear and sustained close above the cloud and its upper band would open the door to a multi-stage rally. Conversely, rejection at these levels - or a decisive move below the $1,280 support - would likely reassert bearish control.
Bull vs. bear - scenario playbook
Outlined below are the primary setups that traders may use, grouped by aggressiveness and directional bias. Each scenario specifies an entry trigger, stop placement, and profit targets aligned with the levels noted on the chart.
-
Bull - Aggressive
- Entry: $1,425 (5-hour close above the 200 SMA)
- Stop: $1,266
- Targets: $1,676 / $1,836 / $2,000
- Risk/reward: 1.57 / 2.58 / 3.61
- Confidence: Medium
- Best for: Momentum seekers
-
Bull - Conservative
- Entry: $1,530 (5-hour close above the Ichimoku cloud and the 50 SMA)
- Stop: $1,266
- Targets: $1,676 / $1,836 / $2,000
- Risk/reward: Higher
- Confidence: Medium
- Best for: Patience pays
-
Bear - Aggressive
- Entry: $1,410 (rejection from the 200 SMA)
- Stop: $1,569
- Targets: $1,171 / $998 / $850
- Risk/reward: 1.50 / 2.59 / 3.52
- Confidence: Medium
- Best for: Quick reversals
-
Bear - Conservative
- Entry: $1,270 (close below the recent higher low)
- Stop: $1,569
- Targets: $1,171 / $998 / $850
- Risk/reward: Higher
- Confidence: Medium
- Best for: Trend followers
Key rules and alerts
- Neutral zone: $1,380 - $1,450 is identified as a no-trade band where price action tends to be choppy and both sides can be whipsawed.
- Double bottom: A double-bottom pattern at $998.64 is flagged as complete and could support a bullish reversal if that level holds.
- Fake-outs to watch: A brief push above $1,425 followed by rejection should be treated as a potential bull trap.
Technicals in plain English
- MACD bullish crossover - indicates short-term buyer interest is increasing.
- Price above the SMA-20 - suggests a short-term trend reversal attempt.
- Medium/long trend - remains under bear influence, constrained by overhead moving averages and cloud resistance.
- Ichimoku cloud - price is inside the cloud (current reference point: $1,414.54), which signals indecision.
- Bullish engulfing candle on July 30 - a recent strong reversal candle noted in the price action.
- ATR: 105.98 (7.49%) - implies sizable moves are common and position sizing should reflect that volatility.
Support and resistance to monitor
- Support to defend: $1,280 - losing this level would likely allow bears to take control.
- Resistance to crack: $1,525 - a sustained break above this level would materially change the technical outlook.
- Bullish divergence: MACD/RSI divergence was confirmed at the $998.64 low.
Lesson
When price action grinds around major moving averages and trading volume softens, the preferred approach is patience. Wait for confirmation - a clear close beyond the Ichimoku cloud or below the identified support range - before committing to a directional position.