
Latest update: Aug 05, 2026, 02:01 PM UTC. This article is regularly updated during market hours.
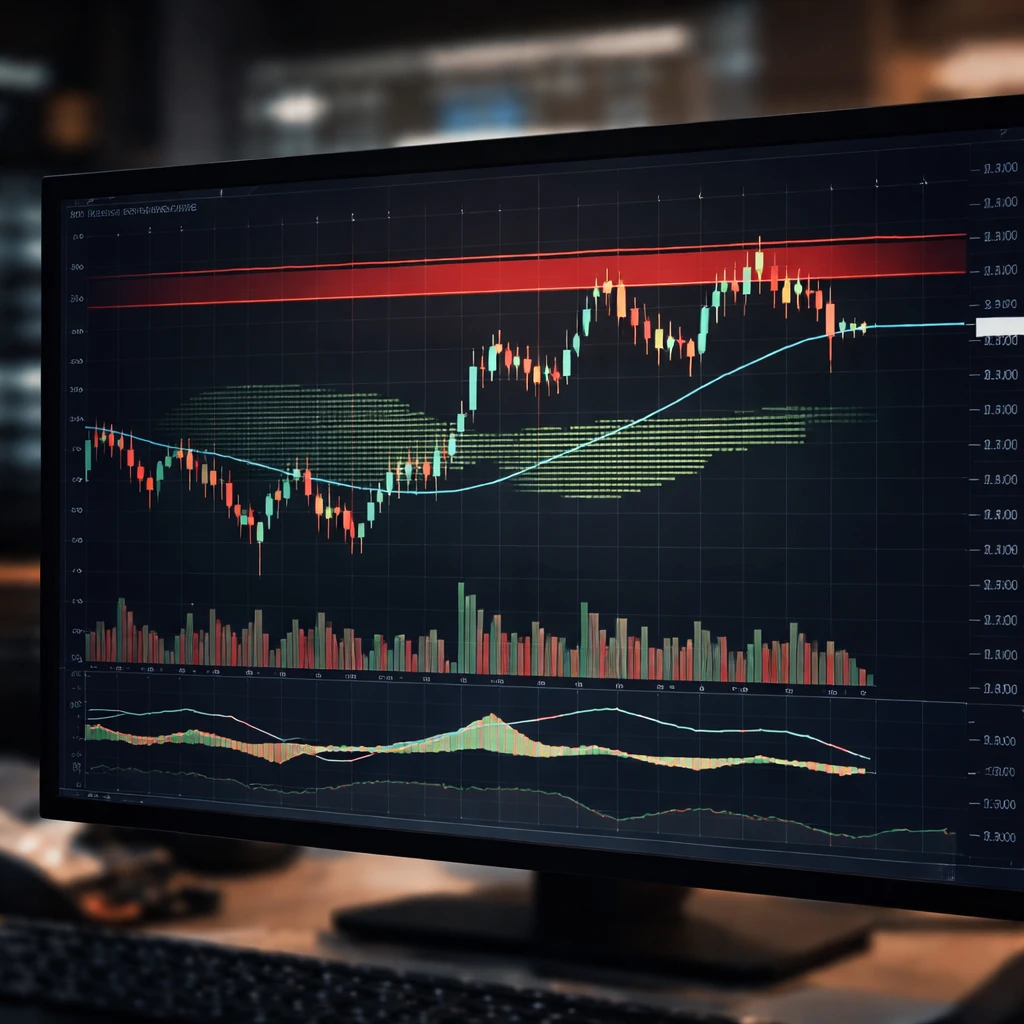
Micron Technology has staged a bullish move on the 5-hour timeframe, taking price to $914.14, but the stock remains pinned beneath a dense resistance band between $925 and $935. That cluster, which incorporates a SuperTrend reading and the 38.2% Fibonacci retracement, has repeatedly acted as a turning point and is central to determining whether the recent momentum extends into a sustained reversal or ends as another false breakout.
Technical backdrop
- Current price: $914.14, trading beneath the main resistance cluster at $925-$935.
- Moving averages and clouds: Price is above the 50-period simple moving average at $909.49 and above the Ichimoku cloud range of $862.50 to $901.09, signaling improving short-term structure.
- Momentum indicators: MACD just produced a bullish crossover, pointing to shift in momentum to the upside.
- Trend caution: The SuperTrend remains bearish at $925.82, while ADX registers 18.72, indicating a weak trend environment.
- Volatility: Average True Range is elevated at 5.28% per bar, implying potential for rapid swings.
Bull and bear playbook
Below are the precision setups presented for short-term traders. Entries, stops and targets are shown exactly as laid out.
- Bull Aggressive - Entry: $915+ momentum; Stop: $875; Target 1: $996; Risk/Reward: 2.02; Confidence: Medium; Best for: Fast-breakout traders.
- Bull Conservative - Entry: $936+ confirmed close; Stop: $875; Target 1: $996; Risk/Reward: 2.02; Confidence: Medium; Best for: Confirmation seekers.
- Bear Aggressive - Entry: $925 (rejection); Stop: $975; Target 1: $825; Risk/Reward: 2.00; Confidence: Medium; Best for: Countertrend players.
- Bear Conservative - Entry: $860 (breakdown); Stop: $975; Target 1: $825; Risk/Reward: 2.00; Confidence: Medium; Best for: Patience required.
Key technical reference points to watch include support at $860, which has been tested multiple times and is forming a double bottom pattern that the analysis estimates to be roughly 60% complete. Overhead, a definitive trend reversal would likely require price to clear $975.
Fibonacci and volume context
The 38.2% Fibonacci retracement sits at $935.61 and the 50% Fibonacci retracement is at $996.35. These levels act as natural resistance and target zones. A breakout past $900 was accompanied by rising volumes, indicating buyer participation, but the accumulation of supply in the $925-$935 band remains significant.
Scenarios to monitor
- If price clears $935 on sustained volume, the path to $996 and then $1,057 could open quickly.
- If the $925-$935 region rejects price, the stock can move rapidly toward $860 or lower.
- Traders are warned that the $915-$935 range is a no-trade zone due to the elevated risk of whipsaw and bull trap activity.
Takeaway
Execution discipline around the identified zones is the key lesson. Entering positions inside the $915-$935 area risks being caught in a bull trap. Waiting for a confirmed close above $936 for bullish conviction or a breakdown below $860 for bearish conviction improves the probability of aligning with directional momentum rather than reacting to intrazone noise.
Pattern note: The chart structure presently supports a double bottom recovery that is still forming. Volume and Fibonacci alignments will determine whether the recovery completes or the plot reverses at the stacked resistance in the $925-$935 band.