
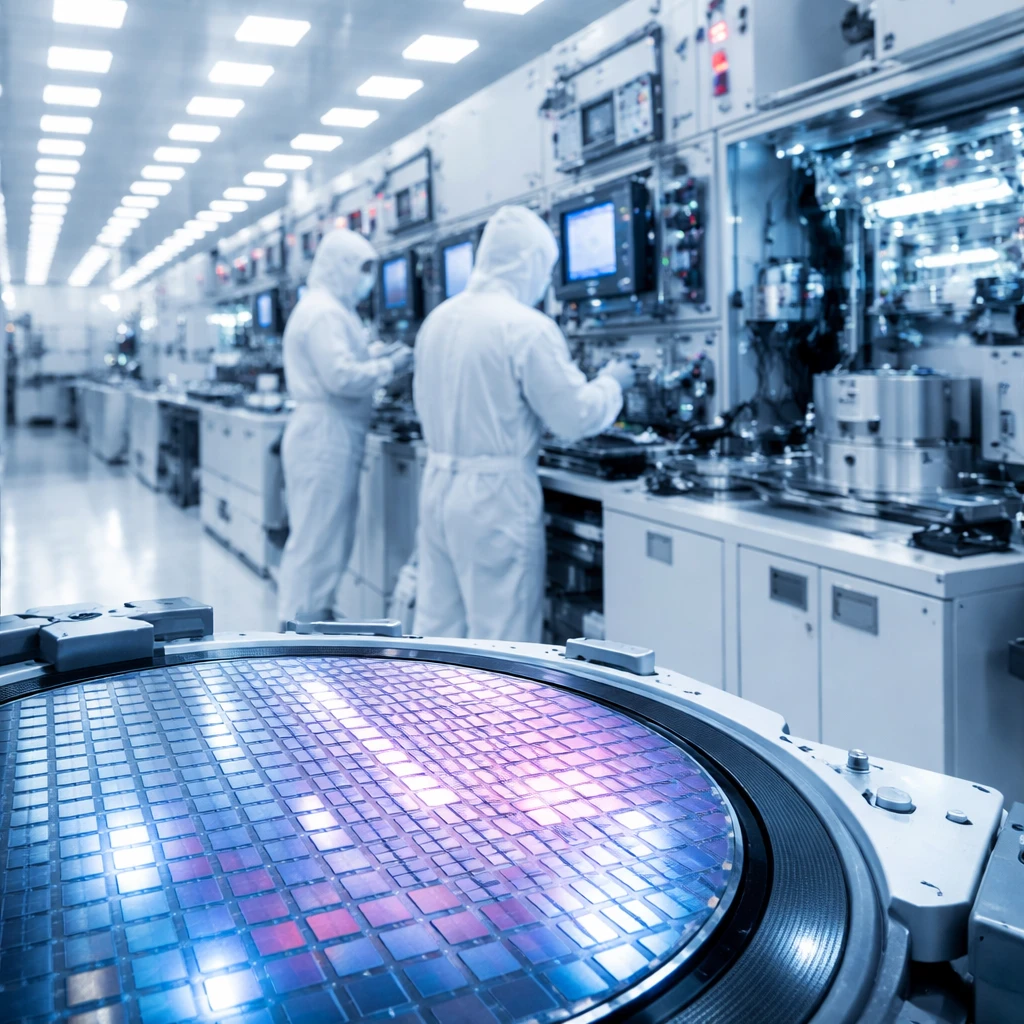
Two of the largest suppliers of semiconductor fabrication equipment moved higher in pre-market trading, but for different reasons. Lam Research Corp. gained as much as 5.22% to $310, while Applied Materials rose about 5.40% to $546 in early action. The market moves mask a clear split - Lam is the cleaner operational story by most efficiency measures, whereas Applied presents the more prominent near-term event risk tied to upcoming earnings.
Scorecard
| Metric | AMAT | LRCX | Edge |
|---|---|---|---|
| Price (Last Close) | $518.21 | $294.61 | - |
| Market Cap | $411.44B | $368.64B | AMAT |
| P/E (LTM) | 48.4x | 50.7x | AMAT |
| P/E (Fwd) | 42.2x | 30.9x | LRCX |
| EV/EBITDA | 43.7x | 42.4x | LRCX |
| PEG Ratio | 1.65 | 1.31 | LRCX |
| Gross Margin | 48.7% | 50.5% | LRCX |
| Net Income Margin | 24.7% | 31.3% | LRCX |
| ROE | 39.7% | 65.1% | LRCX |
| ROIC | 26.3% | 47.4% | LRCX |
| Div. Yield | 0.4% | 0.4% | Tie |
| FCF Yield | 1.3% | 1.3% | Tie |
| Debt/Equity | 30.4% | 29.9% | Tie |
| 1-Year Return | 185.5% | 201.0% | LRCX |
| Fair Value Upside | -28.2% | -18.8% | LRCX |
| Analyst Upside | +25.4% | +22.2% | AMAT |
LRCX's Efficiency Advantage
Across capital efficiency and profitability measures Lam Research holds a notable lead. Its return on invested capital stands at 47.4% versus Applied's 26.3%, implying Lam generates substantially higher returns on reinvested dollars. Lam's return on equity of 65.1% is particularly high for a maker of industrial equipment.
The valuation gap is meaningful as well: Lam trades at a 30.9x forward P/E compared with Applied's 42.2x forward multiple, representing roughly a 27% discount to its peer on a forward-earnings basis despite stronger margins and efficiency metrics.
Those fundamentals were reinforced by Lam's most recent quarter. In Q4 FY2026 the company reported revenue of $6.72 billion, up 30% year-over-year and about 8% above consensus. Guidance for Q1 FY2027 was $8.1 billion, roughly 13.6% above analyst expectations. GAAP operating margin expanded to 37.4% from 35.0% sequentially. Morgan Stanley upgraded Lam to Overweight and HSBC raised its target to $333 from $247 following the results.
AMAT's Upcoming Catalyst Moment
Applied Materials has not yet reported its quarterly results. Management will release Q3 FY2026 earnings after the close on Aug. 13. Analysts expect EPS near $3.36, which would mark approximately 35% year-over-year growth, and revenue around $9 billion. The stock has attracted attention from top firms: Goldman Sachs added Applied to its August U.S. Conviction List while Citi placed the company on a 30-day upside catalyst watch list.
Applied's management has previously guided for greater than 30% growth in semiconductor systems for 2026. That outlook, coupled with the Aug. 13 report, creates a high-conviction near-term trade for investors seeking event-driven opportunities.
One cautionary data point ahead of earnings: insiders sold more than $169 million of Applied shares over the past three months, with no reported insider purchases in the same period. That concentrated insider selling is a yellow flag that investors may weigh against the bullish analyst activity.
The China Overhang
Both companies face the same geopolitically driven demand risk. On July 28 both stocks tumbled roughly 7-8% after reports that a Shanghai state-backed firm achieved mass production of domestic immersion DUV lithography equipment - a potential longer-term threat to Western equipment makers' addressable market in China.
China remains a material portion of Lam's business, representing about 26% of quarterly revenue. Applied carries a similar level of exposure, creating a shared sector-level uncertainty that investors must consider.
Valuation Reality Check
On InvestingPro fair-value measures both companies currently sit above their model-based intrinsic values. Applied's fair value is listed at $372.03, implying about a -28.2% difference to its market price. Lam's fair value is $239.23, indicating roughly a -18.8% gap to its market price. While neither stock appears cheap under these models, Lam is less extended relative to its intrinsic estimate and cheaper on forward-looking multiples.
Bull and Bear Cases
- Lam Bull: Record quarterly performance, strong forward guidance, an immediate analyst upgrade from Morgan Stanley, and superior capital efficiency at a valuation discount. A PEG ratio of 1.31 signals that growth may not be fully priced in.
- Lam Bear: Customer concentration and China revenue exposure of about 26% are meaningful risks. Fair-value models suggest Lam trades around 19% above intrinsic value and analyst targets range around $241 to $355, levels that the stock is already nearing.
- Applied Bull: Inclusion on Goldman Sachs' conviction list and Citi's catalyst watch, together with a roughly 20% share of the wafer fabrication equipment market, create a strong narrative heading into the Aug. 13 report. Bernstein has framed AI infrastructure demand as a potential huge market expansion.
- Applied Bear: The more stretched forward P/E of 42.2x offers less margin for error, and recent insider selling of over $169 million is a caution. Applied appears to trade further above its intrinsic fair value than Lam does under the referenced models.
Verdict
Based on the current data set, Lam Research looks stronger on fundamentals. Its margins, ROIC, ROE, forward multiple and recent earning results position it as the cleaner risk/reward in a multi-quarter, quality-oriented portfolio. Applied Materials, by contrast, presents a high-conviction, event-driven setup into the Aug. 13 earnings release, but that trade brings binary outcome risk and is tempered by notable insider selling.
For investors focused on longer-horizon quality and capital efficiency, Lam's profile is compelling. For traders seeking a near-term catalyst, Applied carries the analyst tailwind into earnings but also material uncertainty. A sector-level caveat applies to both: the potential emergence of domestic Chinese immersion DUV capability and concentrated revenue exposure to China remain shared risks.
One industry note repeated by brokerage research is that demand tied to AI data-center buildouts is still ramping: roughly 50,000 additional silicon wafers per month are required per gigawatt of deployed power, implying ongoing equipment demand as data-center capacity expands.