
Market snapshot
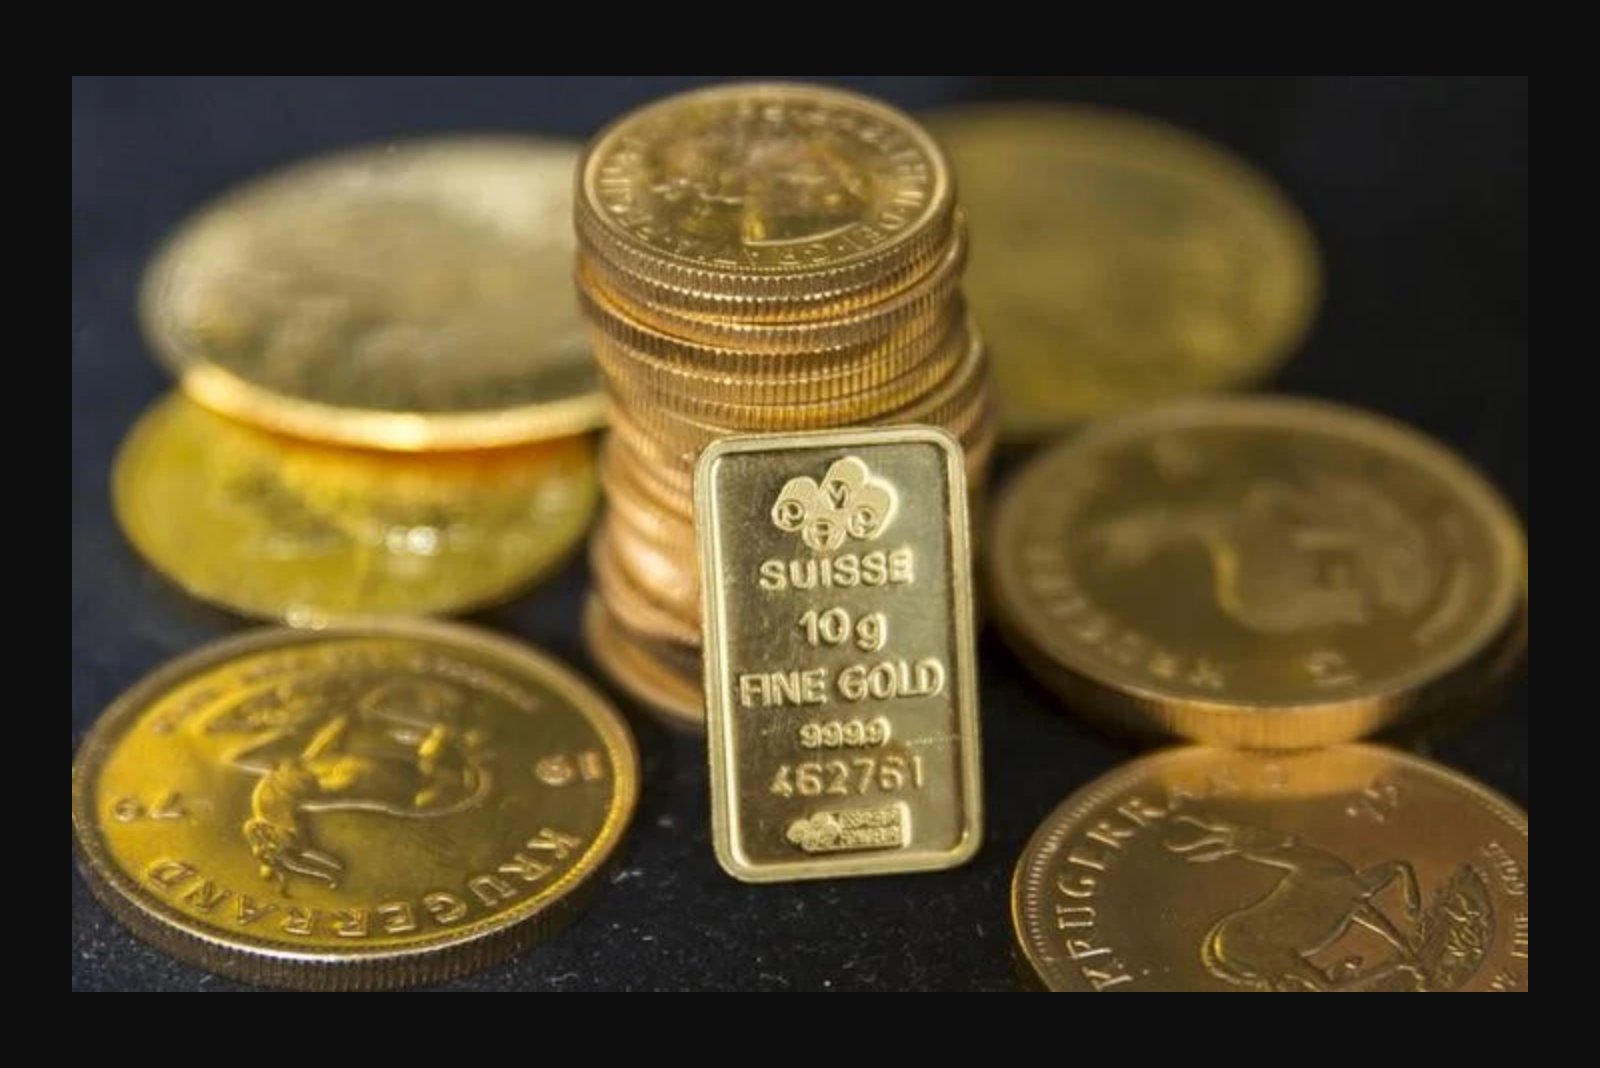
Gold prices paused Monday after tumbling over the previous two sessions. At 21:22 ET (01:22 GMT), XAU/USD was down 0.1% at $4,444.36 an ounce, while Gold Futures were trading 0.3% higher at $4,493.25. Silver (XAG/USD) rose 0.2% to $66.67 an ounce, and platinum (XPT/USD) gained 0.4% to $1,802.60. The U.S. Dollar Index was effectively unchanged at 99.46.
Geopolitical triggers and energy market reaction
Markets moved to price in renewed inflation risk after U.S. and Iranian forces exchanged strikes for the first time in a month. U.S. forces struck Iranian rocket launchers on an island in the Strait of Hormuz on Sunday, stating the weapons were being prepared to deploy mines in the strategic waterway. Iran then struck targets in the United Arab Emirates and Jordan.
That escalation has again focused attention on the Strait of Hormuz as a chokepoint for global energy flows. Oil posted its largest single-session gain in three weeks on Monday, and higher energy prices are relevant to gold because they can contribute to inflation pressures. Rising inflation in turn can strengthen the case for the Federal Reserve to keep policy rates higher for longer or to raise them further.
Rates, opportunity cost, and market pricing
Gold is sensitive to interest-rate dynamics because bullion does not generate interest income. When rates climb, the opportunity cost of holding non-yielding assets such as gold rises relative to interest-bearing securities like government bonds. That relationship has been in focus as markets now price in just over a 60% chance of a 25 basis point Fed rate increase at the September 15-16 meeting, according to the CME FedWatch tool.
Technical pressure and recent price moves
Analysts pointed to a roughly $300 fall from last week’s high near $4,697 to Monday’s low around $4,397 as a combination of hawkish Fed rhetoric and renewed tensions in the Gulf. One market observer said the mix had pushed bond yields higher and left gold exposed ahead of the Fed’s next meeting. The metal has also slipped under its 200-day moving average, which was around $4,526, creating short-term technical damage.
Flows and the debasement trade
Despite the recent pullback, the broader move in August remains powerful: gold posted nearly 10% gains for the month, its strongest monthly advance since January. That rally accelerated after an unexpected decision by the U.S. Treasury to increase purchases of longer-dated government debt, a move that lowered borrowing costs and weakened the dollar.
The Treasury intervention revived investor concern about the scale of U.S. sovereign debt and the potential for currency devaluation. These worries re-energized the so-called debasement trade, a theme already cited as a driver behind gold’s roughly 65% rally in 2025 as investors sought protection from rising deficits and a weakening currency.
Investor demand broadened with gold-backed ETFs registering their largest daily inflow since September 2025 and extending their run of net inflows to five consecutive weeks. However, that momentum has been interrupted by the recent hawkish shift from the Fed.
Implications and near-term focus
Short-term market dynamics will likely continue to be influenced by three intertwined factors documented in recent trading: developments in the U.S.-Iran military exchanges and their impact on energy prices, shifting Fed expectations as signaled by market-implied probabilities and central-bank rhetoric, and technical levels that market participants watch for trading signals. Each of these has implications across commodities, fixed income, and currency markets.
Conclusion
Gold’s stabilization on Monday followed a steep two-day decline driven by a mix of geopolitical risk and higher rate expectations. While flows into bullion-backed funds have been strong in recent weeks, the recent hawkish tone from policymakers and the renewed Middle East tensions have created an environment of competing forces that will likely keep gold-sensitive markets on edge ahead of upcoming policy events.
Prices and market-probability data cited in this article are reported as indicated and reflect trading levels at the times noted.