
Latest update: Aug 31, 2026, 02:21 PM UTC
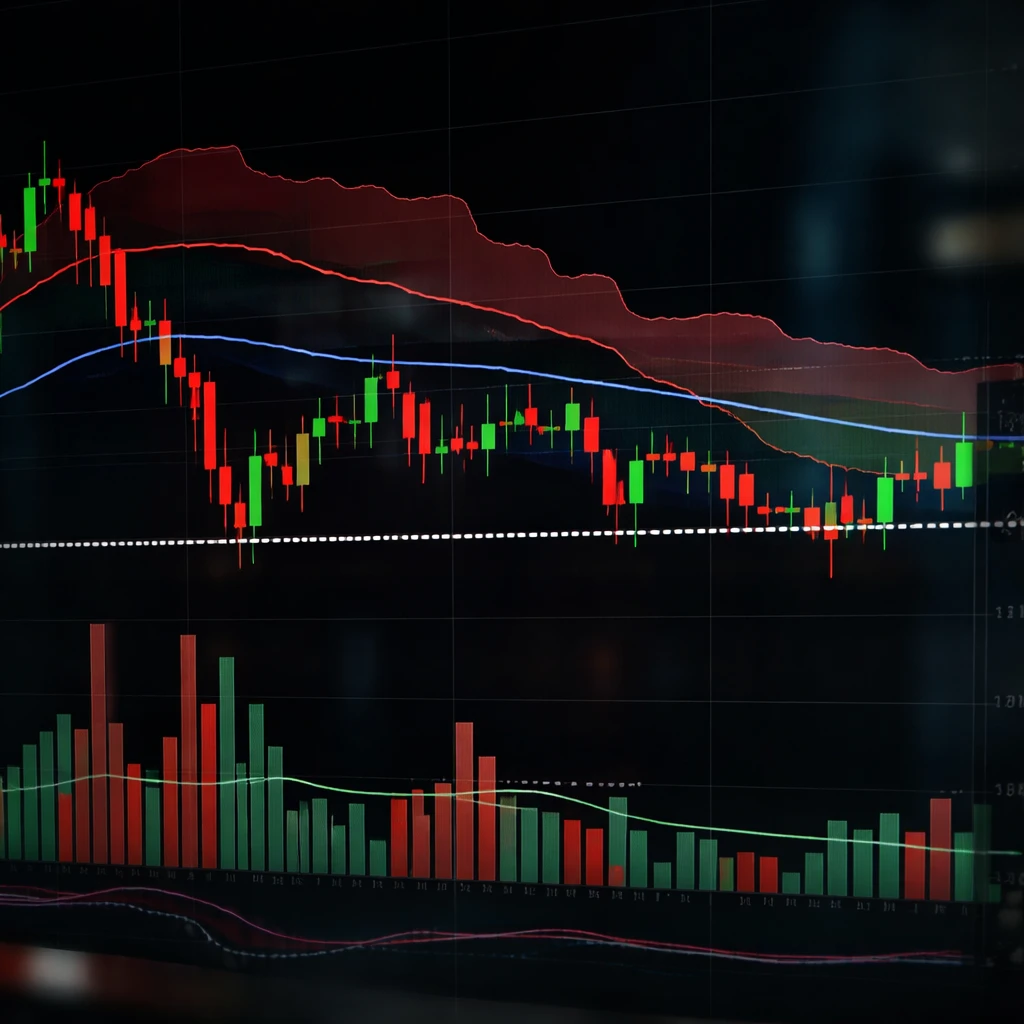
Intel’s intermediate chart is presenting a classic technical standoff. On the 5-hour timeframe the stock is confined to a roughly $10 band between $85.00 support and stiff resistance near $95.00. The prevailing structure is consistent with a bear flag: prices are consolidating under downward-sloping moving averages while momentum indicators and trend overlays continue to favor the sellers.
There are tentative bullish signs: a higher low formed at $85.29 and the MACD is attempting a bullish crossover. However, those developments sit against heavier trend evidence. The price remains well below the Ichimoku cloud, which spans $92.83 to $94.68, and the SuperTrend currently defines resistance at $94.54. Those overhead factors make any sustained upside more difficult to achieve without a decisive break above the upper range.
Trade scenarios and risk frameworks
Below are disciplined trade plans that match the competing technical narratives. Each scenario includes entry, stop, and targets, with stops placed beyond structural thresholds rather than arbitrary levels.
| Scenario | Entry Price | Stop | Targets | Risk/Reward | Confidence | Best For |
|---|---|---|---|---|---|---|
| Bear Agg. | $93.80 (rejection at resistance) | $96.50 (above key averages) | $85.30 / $81.81 / $79.24 | Up to 5.39 | High | Trend followers |
| Bear Cons. | $85.00 (break below support) | $96.50 | $85.30 / $81.81 / $79.24 | Up to 5.39 | High | Reactive traders |
| Bull Agg. | $86.00 (bullish reversal) | $81.50 (below lows) | $95.20 / $100.00 / $106.50 | Up to 4.55 | Low | Countertrend spec. |
| Bull Cons. | $95.50 (confirmed break above MA) | $81.50 | $95.20 / $100.00 / $106.50 | Up to 4.55 | Low | Confirmation-only |
Rationale: The bearish plans rely on the dominant downtrend signals. Moving averages are sloping lower, price sits beneath the Ichimoku cloud and the SuperTrend, and previous rallies have been rejected around $95.00. The bullish approaches only make sense if price can either show a clear reversal from the lower range or reclaim the area above $95.24 with conviction.
Danger zone and mean-reversion cues
Traders should exercise caution inside a mid-range trap. A no-trade recommendation applies between $88.00 and $92.00 where price is likely to be choppy and whipsawed. Within that band, VWAP is at $90.53 and the 20-period simple moving average sits at $90.17, compressing volatility and increasing the chance of false signals.
On the downside, the lower Bollinger Band is near $84.95, which increases the probability of at least a temporary bounce into the middle of the range for mean-reversion traders.
What to monitor next
- A confirmed break below $85.00 would likely accelerate selling pressure. Traders should watch for spikes in volume and a rapid move toward $81.81 and potentially $79.24 in line with the bear-flag projection.
- A sustained move above $95.24 would negate the bear-flag structure and make $100.00 the next meaningful upside target, though resistance in the mid-$90s could still produce bull traps.
- Momentum nuances matter: the MACD histogram shows a bullish divergence versus July’s lows, which signals potential seller exhaustion. That setup requires price-based confirmation before it can be treated as a reliable buy signal.
Chart lesson
Mid-trend ranges like this penalize impatience. The most robust approaches are either to fade rallies off resistance with clearly defined stops or to wait for a confirmed breakdown and then join the directional move. The narrow range, proximity of key moving averages, and compressed volatility mean false breakouts can be swift and losses can compound without disciplined risk management.