This article is for educational purposes and does not contain investment advice or trading recommendations.
Trend following rests on a simple empirical observation. Price changes display periods of persistence where moves tend to continue in the same direction for a time. The practical challenge is not in believing that trends exist, but in deciding when a pullback within an established trend is likely to resume the move and when the same price weakness is the first leg of a larger breakdown. Structured systems address this by explicitly distinguishing two states: continuation and breakdown. The distinction shapes entries, exits, filters, and risk controls in a repeatable framework.
Definitions: Continuation and Breakdown in a Trend Framework
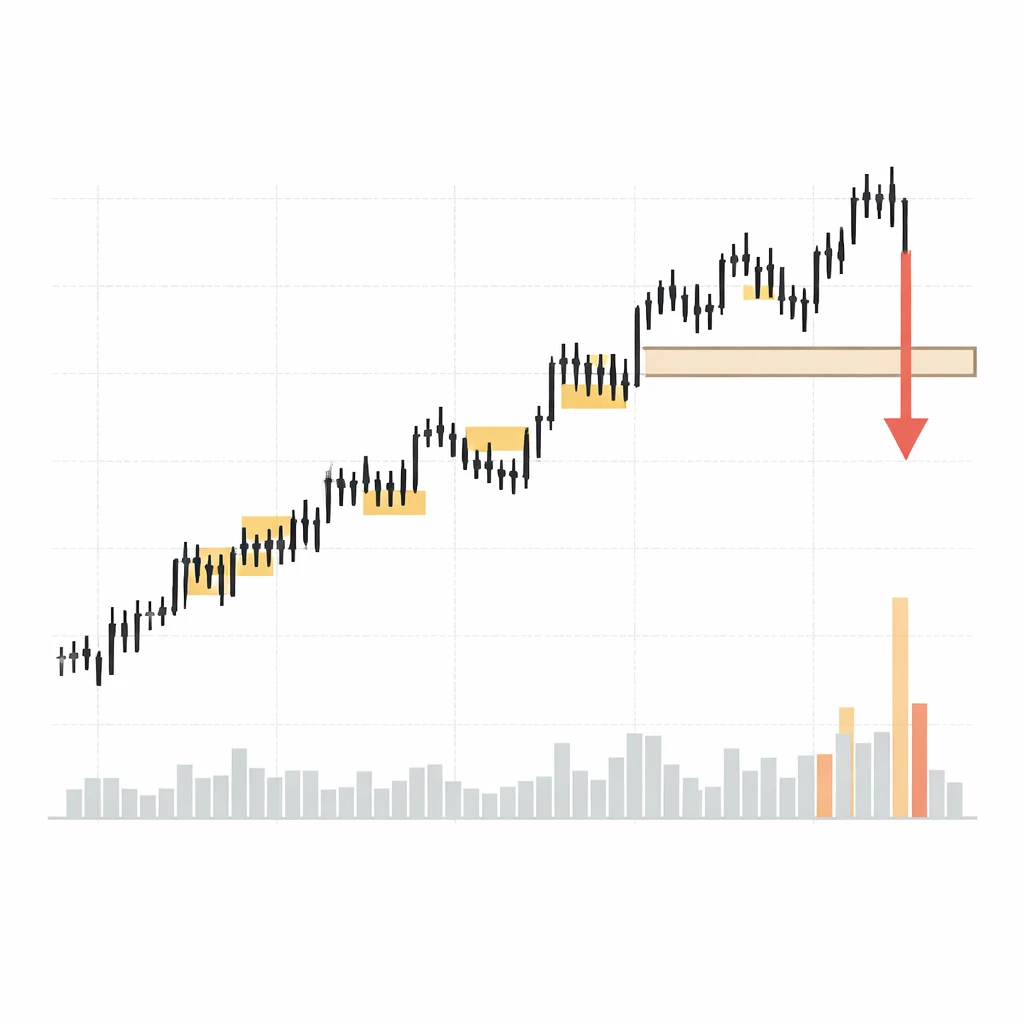
Trend continuation refers to price behavior that resumes movement in the prevailing direction after a pause, pullback, or consolidation. The core idea is path dependency. An uptrend that is intact, with higher highs and higher lows over a chosen horizon, is more likely to continue than to reverse abruptly. Continuation modules exploit this persistence by allowing re-engagement after minor countertrend swings or sideways ranges that lose momentum.
Breakdown refers to price behavior that marks a failure of the prior trend. In an uptrend, a breakdown typically involves a violation of recent swing structure or a transition into lower lows and lower highs accompanied by broader distribution. The label does not require a crash. It simply means the statistical properties that supported continuation have deteriorated enough that the trend definition is no longer satisfied.
These states can be defined with many tools. Practitioners often combine price structure, moving average alignment, volatility regimes, and breadth or cross-sectional confirmation. A key principle is that the definitions should be specific enough to test and repeat, but robust enough to generalize across markets and periods.
Why the Distinction Matters in Trend Following
Trend followers face two recurring sources of loss. First, whipsaws during range-bound markets where continuation signals trigger repeatedly and then fail. Second, late exits after a trend has already transitioned toward breakdown. Systems that explicitly model breakdowns tend to reduce prolonged participation in deteriorating trends, while systems that explicitly model continuations tend to avoid exiting prematurely during normal pullbacks.
Separating these states helps with three practical objectives:
- State-conditional rules. Parameters and tactics that work during continuation conditions can be too permissive during breakdown risk. A separate breakdown state justifies stricter position limits, faster de-risking, or no new exposure.
- Risk allocation. Capital can be preferentially allocated to instruments and timeframes showing continuation evidence, and away from those in breakdown states. This avoids applying the same template to all assets regardless of conditions.
- Expectation management. Continuation episodes often feature lower win rates with outsized payoffs, while breakdown mitigation tends to raise average win rates by avoiding poor conditions. Modeling both helps stabilize the overall distribution of returns.
Core Logic Behind Continuation Strategies
The logic behind continuation is grounded in autocorrelation and flow dynamics. Price trends often persist because of slow information diffusion, institutional constraints that phase large orders over time, and psychological anchoring that delays broad reassessment of value. Continuation modules attempt to align with this persistence after transient adverse movement has reduced short-term crowding and improved the payoff ratio.
A generic continuation approach has several components:
- Trend qualification. A rule set confirms that the asset is in an uptrend or downtrend over the intended horizon. Confirmation can be structural (higher highs and higher lows), indicator based (faster measures aligned with slower ones), or cross-sectional (relative strength within a universe). The method is chosen for clarity and testability rather than complexity.
- Pullback or consolidation recognition. A countertrend move that stays within the bounds of a healthy trend is separated from a structural deterioration. The focus is on depth and duration of the pause relative to the trend’s typical volatility.
- Resumption evidence. The system looks for renewed directional progress after the pause. Evidence can include fresh higher highs in an uptrend, a pickup in directional volatility, or improved breadth if the framework includes market-wide context.
- Risk framing. Continuation setups are evaluated with volatility-aware sizing and predefined exit logic. Because continuation tactics can suffer repeated small losses in choppy markets, position size and risk caps are central to durability.
Crucially, continuation logic is probabilistic. No rule can ensure that a pullback will resume. The principle is to accept small, controlled losses when continuation fails, while preserving the ability to hold when the trend extends further than expected.
Core Logic Behind Breakdown Recognition
Breakdowns reflect a transition in the underlying process. In practice, a breakdown module monitors for a shift from trend structure to distribution structure, then reacts by curbing risk or exiting trend exposure. Identifying breakdowns is not the same as predicting tops or bottoms. It is an exercise in defining thresholds at which the prior trend’s evidence no longer holds.
Several elements usually appear in breakdown logic:
- Structure violation. A sequence of lower lows and lower highs after a mature uptrend, or the opposite after a downtrend, indicates that the market is making progress against the prior direction rather than merely oscillating.
- Volatility expansion. Breakdowns often coincide with an expansion in realized volatility or with outsized ranges relative to recent history. The system distinguishes ordinary pullback volatility from a disorderly regime.
- Failed recoveries. Attempts to resume the trend stall quickly, which shows a change in supply and demand balance. Repeated failure near prior support or resistance is a hallmark of distribution.
- Contextual confirmation. Cross-asset pressure, weakening breadth, or relative weakness within a peer group may support the case that a local issue has become a broader transition.
Breakdown detection benefits from conservative thresholds to avoid frequent whipsaws. The goal is not to exit at the first sign of weakness, but to respond once deterioration is unambiguous within the chosen horizon.
How Continuation and Breakdown Fit Into a Structured, Repeatable System
A practical approach is to formalize market states and create rule modules that operate only when their state is active. One simple framework is a three-layer hierarchy:
- Regime layer. Determines whether the broader environment favors trend following for the asset or universe. Examples include alignment of longer-term measures or broad participation across related instruments. The regime layer does not generate trades on its own. It enables or disables the lower layers.
- State layer. Classifies the instrument’s current condition as continuation candidate, neutral, or breakdown risk relative to the trend horizon. State classification uses strict, testable criteria. This layer is the gatekeeper.
- Tactic layer. Specifies the execution tactics appropriate for the active state. For continuation, tactics might allow re-engagement after a pullback. For breakdown risk, tactics might restrict new exposures, tighten risk caps, or prioritize liquidation rules.
The benefits of this modular structure are clarity, testability, and auditability. Each layer has a narrow mandate. If the system underperforms, diagnostics can focus on a single layer rather than the entire stack.
High-Level Examples
Example 1: Daily Trend Module for a Broad Asset Universe
Consider a daily trend-following framework that evaluates a large group of liquid instruments. The regime layer enables trend activity when a longer-horizon filter indicates sufficient directional alignment. For instruments passing the regime filter, the state layer classifies each as a continuation candidate or breakdown risk.
Suppose a given asset has advanced steadily for several weeks. It then retraces modestly on contracting ranges, holds above prior swing lows, and starts to print higher highs again. The state layer classifies this as continuation. The tactic layer allows continuation exposure subject to predefined sizing and exits. Later, the same asset posts a series of lower lows, rallies fail near former support, and realized volatility expands relative to the prior leg. The state layer reclassifies the instrument as breakdown risk. The tactic layer suspends new continuation attempts and activates tighter risk controls for any residual trend exposure. No specific prices are required to implement this logic, only consistent rules and thresholds.
Example 2: Intraday Trend Module With Volatility Awareness
On intraday timeframes, continuation and breakdown dynamics compress. Consider a session where the market trends higher in the morning. Around midday, it compresses into a tight range with diminishing realized volatility. A brief pullback occurs, but the market quickly re-establishes higher highs and the prior pace. The continuation state remains valid. Later, a sharp selloff breaks the session’s higher low sequence, range widths expand, and rebound attempts are weak and short-lived. The state flips to breakdown risk for the remainder of the session. The tactic layer stops initiating continuation tactics and focuses on risk reduction for any residual trend exposure established earlier.
Risk Management Considerations
Managing risk across continuation and breakdown states is not a single decision. It is a set of consistent practices that shape exposure, loss size, and the distribution of outcomes.
Position Sizing and Concentration
Continuation tactics incur clusters of small losses in choppy markets. Volatility-aware position sizing is a simple way to prevent these clusters from accumulating into destabilizing drawdowns. Sizing by recent realized volatility or by a risk budget per instrument keeps losses commensurate with the backdrop. Concentration caps limit the aggregate effect of multiple correlated continuation attempts across a universe.
Stop Logic and Exit Hierarchies
Systems should specify how exits are triggered, and in what order they take precedence. Exit hierarchies might include structural violations, time-based exits for stale positions, and regime deactivation. It is useful to define which exit has priority when multiple conditions occur together. During breakdown risk, exit thresholds are usually stricter because the distribution of returns can shift toward larger adverse moves.
Volatility Shifts and Liquidity
Breakdowns are often accompanied by rising volatility and thinner liquidity. Slippage and gaps become more likely. A realistic plan accounts for the possibility that the intended exit will not be filled near the theoretical level. Position sizes chosen under calm conditions should remain tolerable under stressed spreads and ranges. Stress testing against historical events helps calibrate this tolerance.
Correlation and Cross-Asset Effects
Breakdowns can cluster across related instruments. A trend follower that treats each asset independently can inadvertently amplify risk through correlation. A portfolio-level risk model that monitors common exposures allows the system to scale exposure across assets coherently. During broad breakdown episodes, the system can reduce overall trend risk rather than only trimming at the instrument level.
Drawdown Policy
Drawdowns are inevitable for both continuation and breakdown-aware systems. A written, testable drawdown policy protects the integrity of the approach. Common elements include thresholds that trigger reduced risk, conditions to restore normal risk, and rules that prevent immediate re-leveraging after a partial recovery. The aim is to keep the system trading while avoiding compounding damage during difficult regimes.
Designing the State Classifier
State classification sits at the core of a continuation versus breakdown framework. It must be explicit, parsimonious, and validated.
- Explicit. Every input and threshold is defined so that two independent implementations would produce the same state at the same time.
- Parsimonious. The classifier uses as few moving parts as practical. Redundant indicators that provide the same information add complexity without stability.
- Validated. The classifier demonstrates robustness in out-of-sample tests across instruments, periods, and reasonable parameter ranges.
Many practitioners begin with price structure and volatility measures, then consider confirmation from cross-sectional strength, breadth, or volume patterns. The key is to avoid tailoring the classifier to one market episode. A classifier that produces believable states in varied conditions is more valuable than one that excels in a single historical window.
Testing and Evaluation
Evaluation of a continuation versus breakdown framework benefits from a disciplined research process.
- Data realism. Use survivorship-bias-free universes where applicable and account for corporate actions, contract rolls, or other domain-specific adjustments. Incorporate reasonable slippage and fees.
- Sample depth. Include multiple market cycles. Continuation logic can appear impressive in one trending period and disappointing in sideways regimes. State classifiers should be tested across both types.
- Walk-forward validation. Fit parameters on a training window, then evaluate on a forward window without re-fitting. Repeat across several folds. Confirm that edge persists without constant re-optimization.
- Ablation analysis. Remove or alter individual components, such as the volatility filter or the cross-sectional confirmation, to verify that each element contributes and is not redundant.
- Distribution analysis. Inspect not only average returns but also the shape of outcomes. Continuation modules often show fat-tailed winner distributions. Breakdown mitigation often reduces left-tail events. Both effects should be visible in the data if the logic is sound.
Common Pitfalls and How to Mitigate Them
Several mistakes recur in this domain. Awareness of these issues improves system durability.
- Overfitting to a single indicator or parameter. A narrow trigger can look excellent in-sample and fail out-of-sample. Favor approaches that remain credible across parameter ranges and instruments.
- Ambiguous definitions of breakdown. If state labels are vague, discretionary bias creeps in during difficult periods. Codify thresholds that force a consistent response.
- Ignoring portfolio interactions. Treating each asset independently can produce a portfolio that is unintentionally concentrated in one theme. Explicit portfolio controls reduce this risk.
- Unrealistic execution assumptions. Backtests that assume immediate fills at mid-prices during breakdowns are unreliable. Use conservative slippage models and consider partial fills.
- State flopping. Frequent switching between continuation and breakdown due to minor noise erodes performance. Introduce hysteresis in state definitions, such as requiring evidence to persist for a minimal duration before the state changes.
Operationalizing the Framework
Turning research into a repeatable daily process requires careful implementation.
- Daily or intraday state maps. Generate a map of instruments by state. This makes capacity planning visible and reduces the temptation to improvise during volatile sessions.
- Predefined playbooks. For each state, list allowed actions, risk caps, and conditions that trigger review. The playbook codifies intent and prevents ad hoc deviations.
- Monitoring and alerts. Automated alerts on state transitions, volatility expansions, and correlation spikes help maintain discipline. Human oversight focuses on exceptions rather than routine checks.
- Post-trade forensics. Tag each trade with the state at entry and exit, then evaluate performance by state. If continuation entries perform poorly during a specific market regime, refine the classifier or the tactic layer accordingly.
Position of Breakdowns vs Continuations Within the Trend-Following Landscape
Trend following covers a spectrum of horizons, from intraday to multi-quarter. Continuation tactics tend to dominate shorter horizons, where opportunities arise frequently but with thinner edges. Breakdown awareness becomes increasingly important at longer horizons, where the cost of being wrong can be large in absolute terms. A mature program often blends multiple horizons, with each horizon carrying its own state definitions, risk budgets, and evaluation metrics.
In a cross-sectional context such as equities, continuation tactics may shift capital toward relative winners while breakdown logic curbs exposure to deteriorating names. In macro or futures contexts, continuation tactics may engage with persistent moves across rates, currencies, and commodities, while breakdown logic manages the inevitable periods of sharp reversals when macro narratives change.
Illustrative Workflow Without Specific Signals
The following workflow demonstrates how a system could operate while avoiding precise entries or exits:
- Universe and data preparation. Define the instruments and the data frequency. Apply standard cleaning routines and realistic execution assumptions.
- Regime check. Evaluate whether the broader environment is permissive for trend following in each instrument or sector. If not, postpone trend tactics.
- State classification. For each instrument, determine whether it is a continuation candidate, neutral, or breakdown risk. Use explicit structural and volatility criteria and, if desired, cross-sectional context.
- Tactics according to state. Enable continuation tactics for continuation candidates. Restrict new activity and tighten risk for breakdown risk states. Keep neutral states on a watchlist pending new evidence.
- Portfolio coordination. Apply portfolio-level caps and correlation-aware sizing. Avoid unintended concentration when many instruments simultaneously present similar continuation or breakdown conditions.
- Review and adaptation. Evaluate performance by state and regime. Adjust thresholds only after sufficient evidence and with careful re-validation, not as a reaction to a single episode.
Practical Example: From Pullback to Breakdown
Imagine an asset that has been trending higher for several months. A pullback develops. During the first phase, the pullback is shallow relative to recent gains and occurs on contracting ranges. Price finds support above a prior swing low. Shortly after, the asset reasserts higher highs. Under a clear set of rules, this behavior qualifies as continuation. Continuation tactics are active with standard risk caps.
Two weeks later, the asset fails to hold the prior swing low. A rebound attempt is brief and stalls below former support. Realized volatility rises above the prior quiet regime, daily ranges widen, and related assets weaken in tandem. The system reclassifies the state as breakdown risk. From this point, the system does not initiate new continuation tactics for the instrument. Any residual exposure follows a stricter exit hierarchy that prioritizes capital preservation. The shift from continuation to breakdown occurs because specific structural and volatility thresholds are breached, not because of discretionary judgment.
Metrics to Monitor
Quantitative monitoring helps determine whether the continuation-breakdown architecture is functioning as intended.
- Hit rate and payoff by state. Continuation tactics often display lower hit rates but higher average payoff. Breakdown-aware exits may increase hit rate by avoiding poor conditions. The combined effect should match the system’s design intent.
- Average holding period by state. Continuation holds tend to be longer during persistent regimes and shorter during choppy conditions. Breakdown-triggered exits should reduce unusually long holds in deteriorating trends.
- Contribution by horizon. If the system spans multiple horizons, track the contribution of each. Underperformance of one horizon might reflect a state classifier that is too sensitive or too inert.
- Drawdown depth and duration. The addition of breakdown awareness should reduce the tail of drawdowns relative to continuation-only variants, subject to the cost of more frequent smaller losses.
- Turnover and costs. State switching increases turnover. Measure whether the expected edge remains after costs and slippage, especially during volatile breakdown episodes.
Adapting Without Overreacting
Markets evolve. A robust framework adapts through evidence-based adjustments rather than frequent reactive tweaks. When diagnostics reveal that the state classifier is too permissive during breakdowns or too strict during continuations, make incremental changes and revalidate over multiple out-of-sample periods. Document changes, rationale, and expected effects. Treat the system as a research project that is always under review, not as a static recipe.
Ethos of a Repeatable Process
The central value of formalizing breakdowns and continuations is not that it eliminates losses or uncertainty. It is that the process becomes repeatable regardless of recent performance. Traders are less tempted to override rules during stressful periods when they can point to clear state definitions, pre-committed risk protocols, and documented expectations. Over time, this discipline can be more important than any single improvement in a classifier or parameter.
Key Takeaways
- Continuation and breakdown are distinct, testable states that organize trend-following logic into a repeatable framework.
- Continuation modules rely on persistence after pauses, while breakdown modules respond to structural violations and volatility expansion that undermine the prior trend.
- Risk management must be state aware, with volatility-informed sizing, exit hierarchies, correlation controls, and drawdown policies.
- State classifiers should be explicit, parsimonious, and validated across markets and regimes to avoid overfitting and ambiguity.
- A modular architecture with regime, state, and tactic layers improves clarity, diagnostics, and day-to-day execution.