Introduction
Breakout strategies seek to identify points where price escapes a well-defined range or boundary and begins to travel in a new direction. The concept of momentum after breakouts focuses on the tendency for prices to continue moving in the breakout direction once that boundary is exceeded and validated by follow-through. Rather than attempting to predict the initial break, this approach studies the persistence of price movement after a break has occurred.
Viewed as a systematic strategy family, momentum after breakouts can be framed as a repeatable process. A system defines a breakout in objective terms, waits for evidence that the breakout is attracting interest and order flow, and then manages exposure using explicit risk controls. The method stands at the intersection of trend following and event-driven trading, where the event is a boundary violation and the follow-through is trend expression.
The discussion below clarifies what momentum after breakouts means, why this mechanism can arise in markets, how one might measure it without prescribing trade signals, and how risk management anchors the approach within a structured, repeatable system. Examples are illustrative and do not specify entries or exits.
Defining Momentum After Breakouts
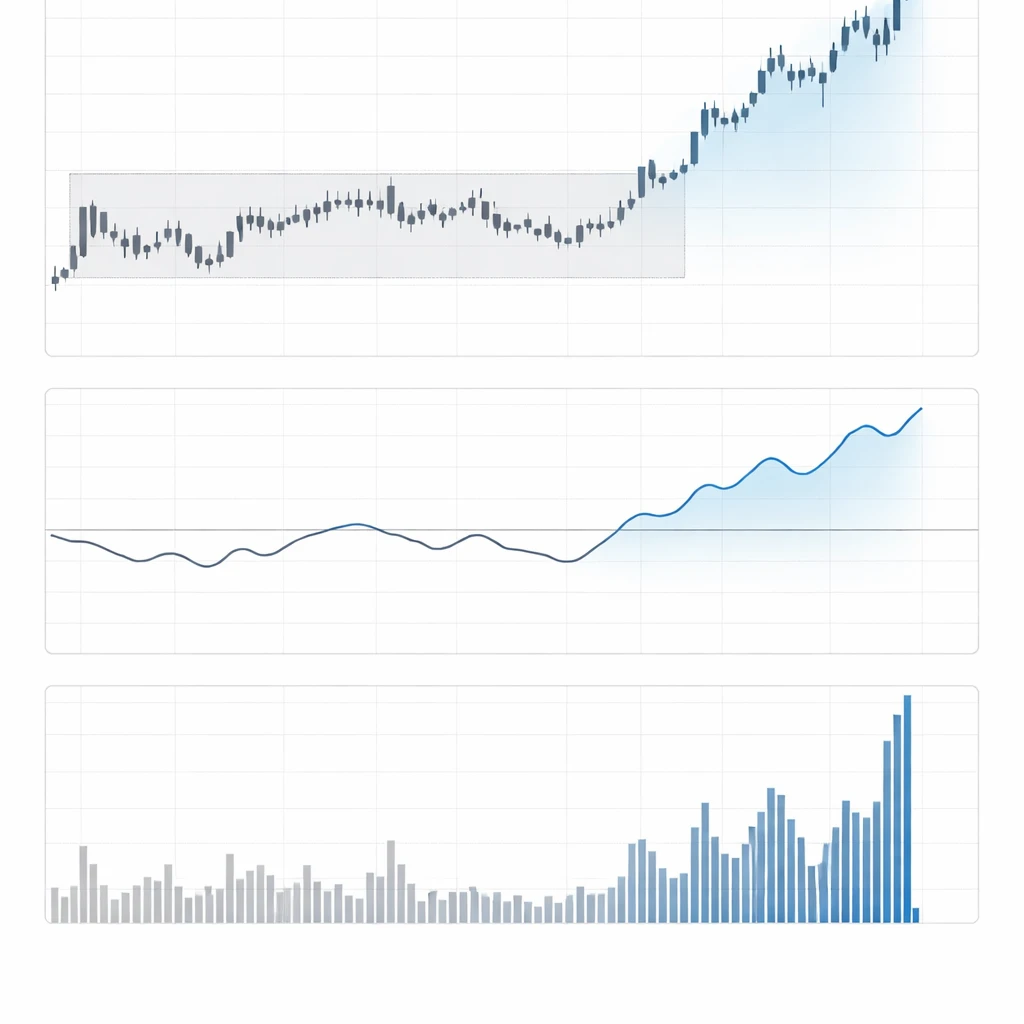
A breakout is an observable price event in which the market trades beyond a prior ceiling or floor. The boundary may be defined by a recent range high or low, a channel, or a statistically derived threshold relative to recent volatility. The core question is whether price tends to continue in the direction of the break once that boundary is cleared. Momentum after breakouts answers in the affirmative under specific conditions. The emphasis is on persistence, not merely the instant of boundary violation.
In practice, the strategy type has two ingredients. First, a mechanical definition of a breakout based on historical prices. Second, a momentum confirmation step that indicates the move is developing sufficient strength, breadth, or participation to justify systematic exposure. The two elements are distinct. Many prices poke through boundaries and snap back. The momentum layer attempts to separate routine noise from directional moves that travel far enough to outweigh the costs and risks incurred.
Economic and Behavioral Rationale
The potential edge in momentum after breakouts is typically attributed to a combination of market microstructure and investor behavior:
- Order flow cascades. Stops from short positions above resistance, or from long positions below support, can trigger follow-on orders. As stops convert to market orders, liquidity thins and price can travel further than expected.
- Information diffusion. New information does not reach all participants simultaneously. Underreaction can leave room for a continuation as additional participants update beliefs over time.
- Volatility and regime clustering. Markets often move through phases where volatility and trendiness cluster. A breakout can coincide with the onset of a more directional regime, allowing momentum to persist.
- Constraints and mandates. Systematic strategies, index rules, and risk budgets can force delayed and staggered participation after an initial move, extending the trend.
These mechanisms do not guarantee continuation. They provide a plausible foundation for why post-breakout momentum may occur often enough, across a diversified set of instruments and periods, to be modeled as a strategy component.
Core Logic of the Strategy Type
The logic is straightforward. Identify an objectively defined boundary. Observe price pierce and hold beyond that boundary. Require evidence that the move is supported by momentum characteristics, such as positive rate of change, aligned moving averages, or directional strength. If conditions are satisfied, manage a directional exposure while risk controls bound adverse outcomes. The objective is not to capture the entire trend from its first tick. It is to capture a representative portion of the directional move that tends to unfold after the breakout is validated.
This approach is different from anticipating breakouts in advance or fading false breaks. It acts after the event and conditions its participation on a momentum filter that aims to reduce whipsaw.
Measuring Breakouts
A repeatable system requires explicit, transparent measurements. Common constructions include:
- Range and channel breaks. New highs relative to a specified lookback window, such as Donchian channels, are widely used because they are unambiguous and distribution-free.
- Volatility-adjusted thresholds. Breakouts defined by price distance scaled by recent volatility, often measured by the average true range, reduce sensitivity to noisy ticks in quiet markets and prevent overreaction in turbulent periods.
- Close-based validation. Some systems prioritize the closing price relative to the boundary to mitigate intraday noise. Others use intraday triggers if the execution horizon is short.
- Structural context. Breakouts from well-formed, multi-touch ranges or congestion zones may carry different properties than marginal highs in drifting markets. The measurement can incorporate pattern quality scores, provided they are defined ex ante and tested for stability.
These techniques can be combined. For example, a system might require a close above a channel high with the distance beyond the high exceeding a fraction of recent average range. The specifics depend on design choices, testing, and the targeted execution horizon.
Measuring Momentum After the Break
Momentum confirmation determines whether the post-break environment exhibits directional strength. Several families of measures are commonly used. The goal is to capture persistence without fitting to noise.
- Rate of change and cumulative return thrust. Short to intermediate lookbacks can show whether the breakout has produced a meaningful directional move. Excessively short windows can be noisy, while longer windows risk lagging turning points.
- Moving average alignment and slope. Directional alignment among multiple averages, alongside upward or downward slope, serves as a simple structural measure of trend consistency.
- Directional strength indicators. Indicators that summarize trend quality or directional movement can help filter breakouts that lack follow-through. Rising directional strength values after the break are a common requirement in systematic rules.
- Range shift concepts. Oscillators that register a shift into strong upward or downward ranges can indicate that pullbacks are shallower and momentum is prevailing.
- Volume or participation expansion. Breakouts accompanied by increased activity often exhibit stronger persistence. Volume can be normalized relative to a lookback average to avoid regime bias.
- Breadth or cross-sectional confirmation. In equities, a breakout in an index accompanied by a high fraction of constituents making new highs can indicate more durable momentum than a narrow move.
Each measurement approach should be defined with minimal degrees of freedom. Stability across similar parameter values is more important than finding a single optimal setting in historical data.
Risk Management Considerations
Risk management gives structure to the strategy and prevents a sequence of false breaks from dominating outcomes. Several layers are typically employed.
Position Sizing
Position size can be scaled to recent volatility so that typical fluctuations represent a comparable risk fraction across instruments. Volatility scaling equalizes risk contribution rather than nominal allocation. In portfolios spanning multiple assets, risk parity or target volatility frameworks can prevent concentration in a single instrument or sector. Sizing rules should be linked to a risk budget that reflects the expected frequency of trades and the drawdowns observed in testing.
Stop Placement and Exit Logic
Different exit families serve different purposes:
- Structure-based stops. Stops outside the breakout zone seek to invalidate the thesis if price re-enters the prior range with conviction. These stops rely on the idea that post-break momentum should not persist if the market returns to congestion.
- Volatility-based stops. Ranges scaled by recent volatility adjust to market conditions, avoiding stops that are too tight in choppy regimes or too loose in quiet markets.
- Trailing mechanisms. Trailing exits give trends room to develop while capping downside from late-cycle participation. Mechanisms can trail price or volatility-adjusted price.
- Time-based exits. A fixed time window can recognize that the edge may be strongest immediately after the break. If momentum fails to materialize within the window, the position is closed to free capital and mitigate opportunity cost.
Combining exit families can increase robustness. For example, a volatility stop can act as a failsafe, while a trailing exit captures extended runs. Time-based logic can clean up stale positions in range-bound markets.
Portfolio Risk and Correlation
Breakouts can cluster across correlated instruments. Managing aggregate risk requires monitoring correlation and concentration. Portfolio heat limits, correlation-aware sizing, and constraints on sector or asset-class exposure reduce the chance that a single market regime inflicts an outsized drawdown. Dynamic correlation, which often rises during stress, should be incorporated into backtests and risk limits.
Execution Risk
Slippage and transaction costs can erode the measured edge, especially for strategies that react immediately after a break. Considerations include the choice of order types, the time of day, liquidity conditions, and the impact of gaps between sessions. Systems that rely on intraday confirmation require high-quality intraday data and careful modeling of fill assumptions.
High-Level Example of Strategy Operation
Consider a broad equity index that has traded within a well-defined range for several months. Price pushes through the upper boundary on elevated activity and closes above it. In the following sessions, directional strength readings rise and shorter moving averages turn upward and align with longer ones. A momentum-after-breakouts framework would interpret the combination of boundary violation and strengthening momentum as a valid setup for directional exposure.
In such a framework, a rule set might include:
- A precise breakout definition based on the prior range or channel.
- A momentum filter requiring confirmation from a small set of indicators, such as rate of change and directional strength, that signal thrust rather than just a marginal poke.
- Volatility scaling for position sizing so that typical daily fluctuations represent a controlled fraction of risk.
- An exit plan that combines a volatility stop, a trailing mechanism to harvest extended runs, and a time window to exit if momentum fails to materialize.
The outcome varies. Sometimes the market trends strongly and the trailing exit captures a meaningful move. Sometimes the market falls back into the range quickly and the volatility stop contains the loss. The key is consistent, rules-based execution and appropriate risk budgeting so that rare large gains can pay for frequent small losses and costs.
A second illustration can be drawn from a liquid currency pair. After a series of lower highs and lower lows, price breaks below a multi-week support zone during a macro event that increases volatility. Post-break, the pair continues to register strong negative rate-of-change values and directional strength readings remain elevated. A system oriented to downside momentum after breakouts would treat that confirmation as a reason to maintain short exposure while it persists, within predefined risk limits. As volatility subsides or momentum decays, the exit logic would scale down or close the position.
Integrating Momentum After Breakouts into a Repeatable System
To function as a repeatable trading system, the concept must be translated into clear rules, tested, and governed. Important design elements include:
- Regime classification. The efficacy of breakout momentum can depend on regime. A simple regime filter might require that longer-term trend measures are not firmly mean-reverting, or that volatility is within a range conducive to directional travel. The filter should be simple enough to generalize beyond the sample used for development.
- Diversification of signals and markets. Applying the same logic across a diverse set of instruments and timeframes can reduce dependence on any single market. Cross-asset diversification is common because breakout dynamics often appear in commodities, currencies, rates, and equities.
- Parameter stability and parsimony. Rules should work across a band of parameter values. If performance collapses when a lookback shifts slightly, the model may be overfit. Parsimony limits the risk of tailoring the system to idiosyncrasies in the sample.
- Walk-forward and out-of-sample testing. Splitting data into development, validation, and out-of-sample sets helps assess robustness. Walk-forward analysis can simulate the live process of periodic parameter updates without data leakage.
- Transaction cost and slippage modeling. Realistic cost assumptions are essential. Any system that depends heavily on immediate post-break entries must demonstrate durability after conservative cost estimates.
- Risk governance. Define maximum drawdown tolerances, per-trade risk caps, and portfolio heat limits. Implement procedures for pausing or reducing exposure after abnormal slippage or structural market changes.
Failure Modes and Mitigation
Momentum after breakouts does not work uniformly. Recognizing failure modes allows a system to mitigate risk proactively.
- False breakouts in mean-reverting regimes. Range-bound markets generate frequent boundary pokes without follow-through. A regime filter and a momentum confirmation requirement can cut the number of false positives, though at the cost of entering later.
- Exhaustion breakouts. Moves that occur after an extended run may represent the final thrust rather than the start of a new leg. Additional filters, such as distance traveled relative to recent volatility or a time-since-last-signal constraint, can reduce late entries.
- News-driven gaps. Sudden gaps can overshoot, then reverse as liquidity returns. Systems can incorporate gap-specific logic, including wider initial risk allowances or deferred participation until the market stabilizes.
- Liquidity droughts. Thin markets can produce erratic breakouts that fail quickly. Minimum liquidity thresholds and higher cost assumptions help avoid optimistic backtests.
- Correlation spikes. During stress, many instruments break in the same direction, amplifying portfolio risk. Correlation-aware sizing and exposure caps limit aggregate downside from synchronized reversals.
Performance Anatomy
Breakout momentum strategies often feature an asymmetric return profile. A typical pattern includes a modest win rate combined with a larger average win than average loss, or a moderate win rate with controlled loss magnitude. Extended trends can dominate long-run results, while sequences of small or moderate losses occur during sideways regimes. The exit framework and position sizing determine how the asymmetry is expressed.
Because the edge, if present, is often thin, transaction costs and delays between signal and execution can materially alter outcomes. This sensitivity reinforces the need for conservative testing, especially at shorter timeframes where noise is high and costs are proportionally larger.
Data, Testing, and Implementation Details
Robust implementation depends on careful data handling and realistic test design.
- Data quality and adjustments. Equity data should reflect corporate actions accurately. Futures data should be constructed with a consistent roll methodology that avoids artificial breakouts at contract transitions.
- Look-ahead and survivorship bias. Ensure that indicators use only information available at the time and that the instrument universe is defined without future knowledge.
- Timezone and session alignment. Breakouts detected on one session close and executed in another must account for gaps and session boundaries. Execution logic should specify the timestamp conventions used.
- Event risk controls. If macro announcements frequently create gaps and reversals, systems can include optional rules that adjust risk or defer execution around known events. Any rule must be defined quantitatively before testing.
Variations and Extensions
The underlying idea can be extended while preserving its systematic nature.
- Multi-timeframe confirmation. Requiring that a breakout on an intermediate timeframe aligns with a broader trend can improve selectivity. For example, a daily breakout that aligns with a weekly uptrend may be more reliable than one that contradicts it.
- Cross-sectional overlays. In equities, combining post-breakout momentum with relative strength can favor instruments with both absolute and cross-sectional momentum. The overlay can influence sizing rather than serve as a separate entry condition.
- Scaling and pyramiding rules. Some systems add to exposure after the market moves favorably by a predefined amount, while others scale out to lock in gains. The rules must be simple enough to test and justify.
- Adaptive thresholds. Volatility regimes can guide adaptive adjustments to the breakout and momentum filters. For instance, in high volatility, requiring stronger confirmation can reduce whipsaw.
Illustrative Walkthrough Without Trade Signals
To connect the elements, consider a structured walkthrough for a hypothetical commodity future that has formed a clear multi-week range:
- Detection. The system tracks the upper and lower bounds of the range and identifies a break when price closes beyond the upper bound by a volatility-adjusted margin.
- Confirmation. Within the following sessions, short-horizon rate of change flips positive and directional strength rises. Volume exceeds its recent average, indicating broader participation.
- Sizing. The position size is set so that a typical adverse move equal to recent average range corresponds to a small, predefined fraction of the portfolio.
- Risk controls. An initial volatility stop protects against immediate failure. A trailing mechanism seeks to retain exposure during favorable continuation. A maximum holding period caps the time capital remains committed without momentum.
- Portfolio context. If several commodities break out simultaneously, correlation-aware limits constrain aggregate exposure to the complex. If equity futures also break, cross-asset caps consider the historical correlation matrix.
- Lifecycle. If price continues to rise and volatility remains contained, the trailing exit stays out of harm’s way. If momentum decays, the trailing exit tightens or the time-based rule removes the position. If price falls back into the range, the volatility stop ends the trade promptly.
This walkthrough demonstrates how the concept integrates into a rule set that can be coded, tested, and monitored without specifying a particular entry tick or exit price.
When Momentum After Breakouts Fits a System
Momentum after breakouts aligns with systems that embrace delayed confirmation and probabilistic thinking. Because the approach waits for a boundary to break and for momentum to present, it accepts that some portion of the move may be missed in exchange for a higher rate of follow-through. It tends to perform better in markets and periods where trends emerge from consolidation and persist long enough to offset costs. In contrast, it can struggle when microstructure noise dominates, such as during range-bound intervals with frequent mean reversion.
In multi-strategy portfolios, momentum after breakouts can complement mean reversion, carry, or value-oriented signals by tapping a different return driver. The diversification benefit relies on low correlation of signals and a risk allocation framework that prevents one style from dominating exposure.
Governance and Ongoing Evaluation
After deployment, the system should be monitored against its historical behavior. Key elements include:
- Process adherence. Confirm that real-time decisions follow the documented rules, including data cutoffs and execution windows.
- Drift and regime change. Compare realized distributions of returns and holding periods to historical distributions. Significant drift may indicate regime change, data issues, or model decay.
- Cost and slippage tracking. Record realized costs. If they exceed assumptions, reassess holding horizons, instrument selection, or execution tactics.
- Stress testing. Evaluate the system under extreme but plausible scenarios to understand drawdown potential and liquidity needs.
System integrity depends on disciplined documentation, periodic validation, and conservative assumptions about what can be achieved in live markets.
Concluding Remarks
Momentum after breakouts is a structured response to a well-defined market event. By separating the detection of a boundary violation from the confirmation of momentum, the approach attempts to capture the tendency for prices to continue in the breakout direction for a time. Success depends on clear definitions, parsimony in measurement, robust risk management, and an honest accounting of costs. Framed in this way, momentum after breakouts becomes a candidate building block within a diversified, rules-based trading program.
This material is for educational purposes only and does not contain investment advice or recommendations. Examples are illustrative abstractions and omit specific trade signals, prices, and execution details.
Key Takeaways
- Momentum after breakouts focuses on persistence following a boundary violation, not on predicting the initial break.
- Confirmation through momentum, participation, and regime context helps distinguish true continuation from noise.
- Risk management, including volatility-scaled sizing and layered exits, is central to strategy viability.
- Diversification across instruments and timeframes, along with conservative testing, improves robustness.
- Outcomes are sensitive to costs, execution, and regime, which require ongoing measurement and governance.