Breakout strategies occupy a central place in systematic trading because they offer a simple organizing idea. When price escapes a well-defined range with sufficient participation, the path of least resistance can shift, and a new directional move may begin. This premise has intuitive appeal and a long history in trend research. Yet the same simplicity that makes breakouts attractive also limits them. Markets spend much of their time consolidating, reversing, and reacting to information in a way that frustrates clear directional follow-through. Understanding these limits is essential for anyone who seeks to integrate breakouts into a structured and repeatable trading system.
This article defines the limits of breakout strategies, explains the core logic that motivates them, and outlines risk management practices that respond directly to their vulnerabilities. It also provides a high-level, non-prescriptive example of how a breakout strategy operates inside a disciplined process. The objective is educational clarity rather than specific trade instructions.
Defining Breakouts and Their Limits
A breakout strategy attempts to capture the moment when price transitions from consolidation to expansion. The operational idea is that a move beyond a recent range, when accompanied by supportive conditions such as liquidity and participation, can ignite directional flow. The conditions used to define a range, detect the escape, and validate participation vary widely across implementations. The common thread is a focus on regime change from balance to imbalance.
Limits of breakout strategies refers to the structural, statistical, and operational boundaries that constrain the edge of breakout tactics. These limits include the prevalence of false breakouts in mean-reverting environments, sensitivity to parameter choices, degradation from transaction costs and slippage, capacity constraints in less liquid markets, and the possibility of long sequences of small losses that test risk budgets. The concept also encompasses model risk, such as overfitting to historical windows that may not repeat, and fragility to microstructure features like gaps around news events.
Core Logic Behind Breakout Trading
Breakout logic rests on a set of behavioral and microstructure observations.
- Inventory imbalance and stop clusters. When price traverses a well-watched boundary, orders that accumulated during the range can convert rapidly to marketable demand or supply. Stop orders and defensive unwinds create a transient liquidity vacuum that propels price.
- Volatility expansion after compression. Empirical work across many markets shows that volatility is clustered. Quiet periods are often followed by larger moves. A breakout setup seeks to position near the beginning of that expansion.
- Information release. Consolidations often precede macro data, earnings, or policy decisions. The post-event directional move can align with the breakout direction, provided the market digests the information in a one-sided way.
- Path dependency. The same price level can behave differently depending on how price approached it. A slow grind to a boundary with heavy participation may behave differently than a sharp spike into the boundary.
This logic is not a guarantee of trend initiation. It is a probabilistic statement that seeks a favorable distribution of outcomes conditional on specific structural context. The limits of breakout strategies arise precisely where these conditions fail or are overwhelmed by opposing forces.
Where Breakout Logic Breaks Down
1. False Breakouts in Mean-Reverting Regimes
Many markets spend extended periods in which liquidity providers dominate. In such environments, prices probe beyond recent extremes but revert quickly. A breakout entry can be filled near the extreme and then mean-revert into a loss. The phenomenon is common near prior highs or lows that attract contrarian supply and profit taking. The frequency of these false starts varies by asset class, time of day, and macro backdrop. It increases when volatility is modest and order flow is two sided.
2. Sensitivity to Parameter Choices
Breakout rules rely on definitions of range, lookback, and validation. Slight changes in these choices can produce different trade sequences. In historical testing this sensitivity can be hidden by favorable sample windows, giving the appearance of robustness. Parameter instability becomes more acute when a strategy attempts to optimize thresholds to maximize past returns. The apparent edge may be a product of data mining rather than a stable mechanism.
3. Costs, Slippage, and Latency
Breakouts often occur during rapid price discovery. Executing at these moments can be expensive. Market orders can suffer slippage when liquidity thins. Limit orders reduce slippage risk but carry non-fill risk and may miss the move entirely. Shorter holding periods compound the impact of costs. An apparently profitable edge on paper can disappear once realistic costs, partial fills, and delays are included. This is a central limit of high-frequency breakout designs.
4. Capacity and Liquidity Constraints
In less liquid instruments, a breakout entry can move price further, especially if similar models act together. The larger the position, the more the strategy becomes the market. Capacity limits are hard to estimate precisely without live data and careful measurement of footprint. This constraint narrows the feasible universe of instruments and affects the scalability of any breakout-driven approach.
5. Event and Gap Risk
Breakouts that coincide with scheduled announcements or unexpected news can gap through intended protective levels. This creates discontinuous outcomes that are worse than modeled continuous-time assumptions. Gap risk is part of the limit structure of all directional strategies, but it is particularly salient for breakouts that trigger around event windows.
6. Regime Dependence and Crowding
When many participants pursue similar breakout signals, the first move can be sharp but short-lived. Crowding produces fast in-and-out behavior and reduces the probability of sustained trends. Moreover, macro regimes characterized by frequent policy reversals or range-bound indices can diminish the follow-through that breakouts seek to capture.
7. Backtest Fragility
Backtests of breakouts are vulnerable to subtle biases. These include survivorship bias in the instrument set, look-ahead bias in using indicators computed with information unavailable at decision time, and improper treatment of gaps between sessions. Without careful controls, the historical record can overstate reliability. Recognizing this fragility is part of acknowledging the limits of the approach.
Risk Management Considerations Tailored to Breakouts
Risk management is not an add-on; it is the framework that gives a breakout system its practical shape. Because breakouts can see many small losses followed by periodic larger gains, the distribution of outcomes requires special attention to loss control and capital deployment.
Position Sizing and Capital at Risk
Position sizing should be linked to expected variability and worst-case excursions rather than a fixed number of contracts or shares. Volatility scaling, risk parity within a strategy sleeve, and fixed-fraction sizing are methods that can align trade size with risk budgets. Using aggressive growth formulas can be hazardous because the true edge is uncertain and time-varying. Conservative sizing gives the strategy room to survive sequences of whipsaws that are common in range-bound markets.
Defining Loss Boundaries Without Precision Engineering
Protective exits are part of the breakout concept because the hypothesis is invalidated when price returns inside the range and persists there. The exact mechanics of stops and exits vary, but the principle is clear. Maintain a predefined loss boundary that bounds adverse excursions to a tolerable level and reduces exposure when the regime signal contradicts the breakout. Time-based exits can also prevent capital from idling in a stalled trade that no longer expresses the original thesis.
Regime Filters and Trade Qualification
Breakouts are conditional events. Filters can improve the trade distribution by qualifying when to engage. Examples include volatility regime identification, measures of market breadth, liquidity and spread conditions, and avoidance of high-uncertainty event windows. The purpose of a filter is not to forecast direction, but to avoid contexts in which the breakout mechanism historically underperforms. Each filter adds complexity, so it should be justified by stable evidence rather than short-sample convenience.
Exit Logic and Asymmetry
Outcomes for breakout trades often exhibit asymmetry. Many small losses or scratches are punctuated by a subset of trades that carry most of the gains. Exit logic should be designed to preserve this asymmetry. Methods that cut winners prematurely may raise hit rate but can eliminate the long right tail that funds the strategy. Conversely, unbounded losses can convert a manageable whipsaw into a large drawdown. The balance between protective discipline and the opportunity to realize extended moves is a central risk decision in breakout design.
Portfolio View and Correlation Management
Few breakout strategies function in isolation. A portfolio of instruments and timeframes can diversify idiosyncratic risk. That said, correlations rise in stress regimes, and many instruments can break out together in response to macro shocks. Position limits and global exposure checks should account for the possibility of concurrent signals across related assets. Structured position caps and stress tests against historical crisis periods can bound this cluster risk.
Drawdown Governance and Kill-Switches
Formal drawdown thresholds, when combined with a pause or de-risk rule, act as circuit breakers. Their role is to prevent compounding of model errors when conditions deviate from assumptions. A kill-switch is not a prediction about the future. It is a governance control that pauses deployment to protect capital and to create space for diagnostic review when losses exceed expected bounds.
Execution Discipline
Execution is often the difference between theoretical and realized outcomes. Breakout entries tend to cluster when spreads widen and depth thins. Slippage controls, order type selection, and venue routing policies should be explicit parts of the system specification. The system should also define what happens when planned orders do not fill, because partial participation changes risk and expected outcome.
High-Level Example of a Structured Breakout Strategy
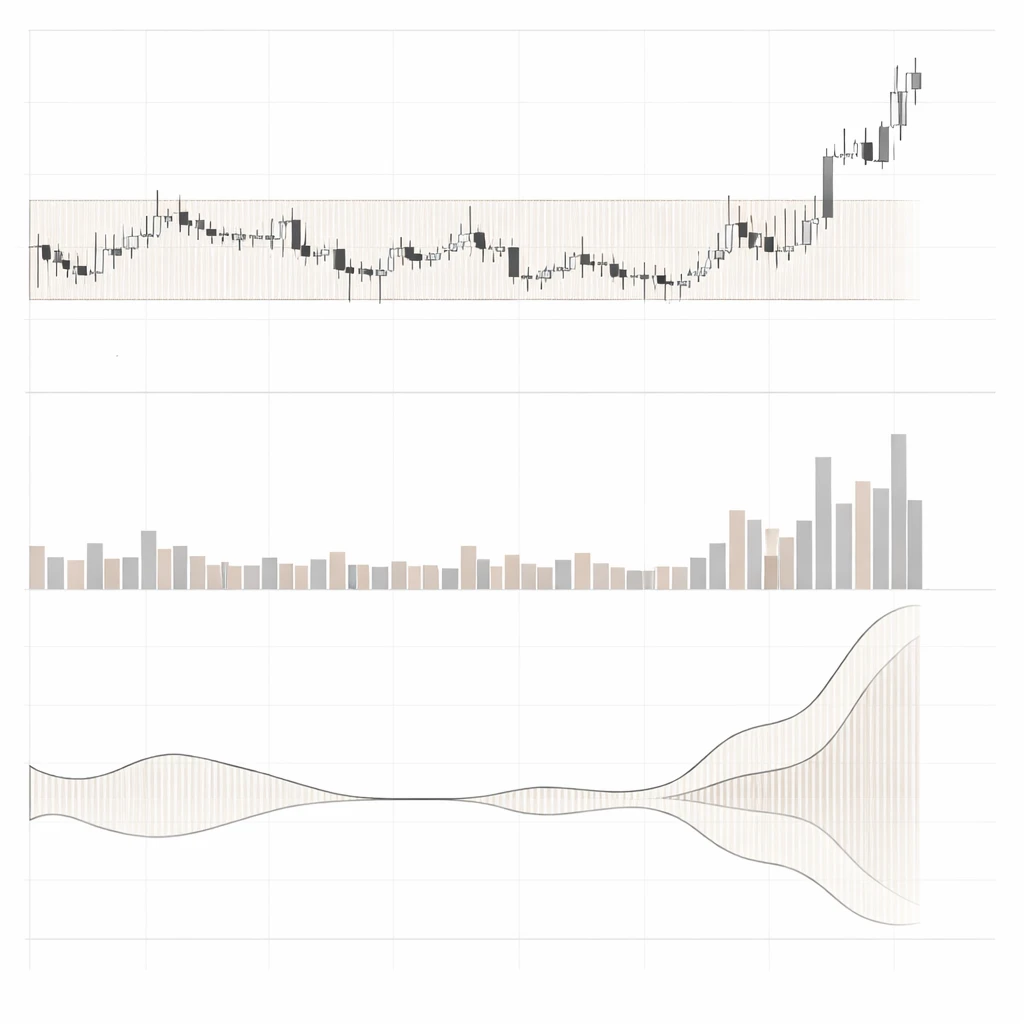
The following example illustrates the structure and decision points of a breakout strategy without providing prescriptive signals or price levels. Consider a liquid equity index future that has spent several weeks oscillating within a relatively narrow band. Volatility has compressed and realized ranges are small. Market participation is average, and there are no imminent major policy announcements.
Hypothesis. A sustained move outside the multi-week range, especially if accompanied by rising participation, can mark the transition from balance to directional discovery.
Signal definition. The system defines a recent range using a fixed, transparent rule. A breakout event occurs when price trades and closes beyond the range boundary with supportive market conditions. The design avoids ad hoc exceptions and keeps rule count minimal.
Risk controls. The system establishes a predefined loss boundary that limits adverse excursion. It also enforces a time stop that exits if price fails to continue in the breakout direction after a specified window. Position size is calibrated to a volatility budget so that a sequence of several routine losses can be absorbed within the strategy sleeve.
Filters. The strategy engages only when spreads are normal, depth is adequate, and there are no scheduled high-uncertainty announcements within a defined buffer. It also requires that the broader market is not already extremely extended in the breakout direction, to avoid late-stage exhaustion.
Execution. The system uses an execution protocol that balances slippage and fill risk. The details are coded and tested in historical and live-forward environments to ensure the fill model is realistic. The protocol includes rules for partial fills and for situations where an initial order is skipped by a sudden gap.
Lifecycle. After entry, the system monitors participation and volatility. If the move follows through, the strategy manages the trade with a protective logic that allows gains to grow while managing downside. If the move stalls, the time-based exit removes the position. All actions are recorded to support post-trade analysis.
Outcomes. In one path, the breakout continues and delivers a multiple of the typical loss unit, which funds several small prior losses. In another path, the breakout fails quickly and reverts into the range, resulting in a controlled loss. A third path features an initial push, a pullback that tests the boundary, and a later extension. The strategy’s exit and re-engagement logic determines which parts of this sequence it captures. None of the paths require prediction of long-term trend; they require only that the system reacts consistently to defined conditions.
Embedding Breakouts in a Repeatable System
A repeatable trading system reduces reliance on discretionary interpretation and personal mood. It moves the focus from finding a perfect setup to operating a controlled process. When integrating breakout logic, the following structural elements matter.
Clear Hypothesis and Testable Rules
State the behavioral or microstructure rationale. Specify how ranges, breakouts, and validations are defined. Make each rule falsifiable by data. This creates a foundation for ongoing evaluation and prevents silent drift in rules over time.
Backtesting with Robustness Checks
Breakouts are sensitive to sample windows. Robust testing uses multiple regimes and markets, out-of-sample periods, and walk-forward validation. Monte Carlo resampling of the realized trade sequence helps estimate the distribution of drawdowns under different orderings of wins and losses. These techniques cannot eliminate uncertainty, but they reveal the variability one should expect from a strategy that harvests occasional large moves amid frequent small losses.
Cost, Slippage, and Capacity Modeling
Include realistic transaction cost models that reflect spreads, depth, and impact. Test capacity by scaling hypothetical order size and measuring deterioration. Strategies that look appealing at tiny size can fail when scaled. Documenting capacity prevents accidental over-deployment.
Regime Classification and Monitoring
Because breakout edge is regime dependent, define a small set of regime descriptors. Examples include volatility state, liquidity conditions, and cross-asset trend alignment. The system should log performance by regime and update dashboards that show whether current conditions resemble past periods of strength or weakness. This monitoring is descriptive, not predictive. It informs allocation decisions across strategy sleeves within a pre-set governance process.
Model Risk Management
Document assumptions and known failure modes. Institute periodic challenge reviews in which an independent perspective attempts to break the model. Version-control code and maintain a changelog for any rule adjustment. Require a cooling-off period and out-of-sample verification before deploying major changes. These disciplines make the strategy more durable under uncertainty.
Operational Resilience
Breakouts often trigger at times of fast market movement. Ensure monitoring, data feeds, and order routing are resilient. Run pre-trade checks for missing data, stale indicators, and inconsistent symbol mappings. Post-trade reconciliation should verify fills and costs. These details reduce operational errors that would otherwise dominate small statistical edges.
Interpreting Performance and Drawdowns
A defining feature of breakout strategies is lumpy performance. The hit rate can be modest, while the payoff ratio carries the edge. Expectancies of the form E = p multiplied by average win minus (1 minus p) multiplied by average loss are sensitive to both terms. If costs rise or the right tail of winners is truncated, the expectancy can flip negative even without obvious changes in raw signal quality. Analysts should break down results into hit rate, average gain, average loss, average hold time, slippage, and regime attribution. This decomposition shows whether losses come from higher costs, less follow-through, or too-tight exits.
Drawdowns are inevitable. A common pitfall is to respond to a typical whipsaw sequence with large parameter changes that remove the payoff tail. Decisions during drawdowns should adhere to a pre-defined governance plan rather than ad hoc adjustments. That plan can include temporary de-risking, reduced allocation to the breakout sleeve, or additional diagnostics, but should not rely on the belief that a turning point is imminent.
What Breakouts Are Not
Breakout strategies are not universal market timers. They do not forecast macro outcomes or guarantee participation in every major trend. They are not precision tools for capturing exact tops or bottoms. They provide a rule-based way to engage when market structure shifts from balance to imbalance, subject to known failure modes. Understanding these boundaries helps prevent misuse.
Practical Implications of the Limits
The limits of breakout strategies suggest several practical implications for system design and oversight.
- Expect variability. Performance will fluctuate with volatility and liquidity regimes. The strategy should be sized so that normal sequences of small losses do not force premature abandonment.
- Keep rules simple and testable. Complexity can overfit. Each added parameter demands evidence and increases maintenance load.
- Be explicit about costs and execution. The edge is small relative to adverse selection during fast moves. A cost-aware execution plan is part of the strategy, not a separate problem.
- Measure capacity. Without capacity estimates, slippage surprises will arrive exactly when the strategy appears to be working best.
- Use a portfolio lens. Combine breakout sleeves with other uncorrelated approaches to smooth equity curves. Manage correlation spikes during stress.
A Balanced View
Breakout strategies endure because they encode a repeatable response to a common market transition. The same structure that creates opportunity also creates risk. False breaks, costs, gaps, and crowding define the edges of the map. Treating these edges as design constraints rather than nuisances produces better systems. In a professional setting, that means codifying the hypothesis, measuring performance by regime, modeling costs and capacity, and instituting governance that moderates human reactions to inevitable drawdowns. Within such a framework, breakout tactics can serve as a disciplined component of a broader portfolio of rules-based strategies.
Key Takeaways
- Breakout strategies aim to capture transitions from balance to directional discovery, but their edge is conditional and regime dependent.
- False breakouts, parameter sensitivity, costs, and capacity constraints are structural limits that must be designed for explicitly.
- Risk management for breakouts centers on position sizing, loss boundaries, execution discipline, and correlation control across a portfolio.
- Robust testing and governance reduce backtest fragility and prevent reactive changes during normal drawdowns.
- Within a structured, repeatable system, breakout tactics can contribute to diversified returns, provided their limits are respected and monitored.