Overview
Ranging markets are periods in which price oscillates between relatively stable upper and lower boundaries with limited net direction. Breakout strategies in this context seek to capture the transition from containment to expansion. The hypothesis is straightforward. When price escapes a well-defined range, the market may be revealing new information, shifting participation, or releasing built-up pressure, and this can lead to a directional move that is larger than the typical fluctuations observed during the range. Because these strategies are rule based, they can be integrated into structured, repeatable trading systems that emphasize definitional clarity, risk control, and objective evaluation.
This article defines breakouts in ranging markets, explains the behavioral and microstructural logic that supports the approach, outlines risk management considerations, and presents a high-level example of how a strategy of this type operates within a systematic framework. No trade signals, specific prices, or recommendations are provided.
Defining Ranges and Breakouts
Ranging market refers to a period in which price fluctuates within a bounded zone for a nontrivial length of time. Traders often describe this zone using the highest prices reached near the top of the range and the lowest prices near the bottom of the range. The range must be specific enough to be measured and tested, yet broad enough to avoid reacting to ordinary noise. Definitions commonly rely on:
- Duration. The market remains within a bounded area for a specified number of sessions or bars.
- Depth. The distance between the upper and lower boundaries is small relative to recent volatility.
- Stability. Repeated rejections occur near the same approximate levels, with no sustained follow through beyond the boundaries.
Breakout refers to price leaving the established range with sufficient movement and persistence to indicate that the previous state of containment has ended. A range exit can be defined by a set of objective criteria, for example a move beyond the prior boundary by more than a typical fluctuation, possibly accompanied by signs of increased participation such as higher activity. The precise rules used to qualify a breakout should be specified in advance so that they can be tested and applied consistently.
Core Logic and Behavioral Foundations
Breakout strategies rely on a few consistent ideas drawn from market behavior and microstructure.
- Information release and re-pricing. Ranges often form when the market is digesting information or when participants disagree about value. When new information arrives or existing participants change their expectations, the balance can shift quickly, producing directional repricing beyond the prior bounds.
- Liquidity concentration near boundaries. Orders tend to cluster around range highs and lows. When price approaches these areas, opposing orders may absorb advances and reversals can follow. If that resting liquidity is removed, a void can form and price can move rapidly as order books adjust.
- Stop orders and trapped positioning. Traders who bet on the range persisting often place risk controls just beyond the boundaries. A decisive move through one side of the range can trigger these orders, which adds fuel to the initial push and can produce a self-reinforcing move.
- Volatility regime shifts. Consolidations are commonly lower volatility regimes. Breakouts are often accompanied by a transition to higher realized volatility, which changes the distribution of potential outcomes for a period of time.
The strategy’s edge does not require predicting the direction of the breakout. Instead, it seeks to condition exposure on the market’s own evidence that a state change has occurred.
Identifying Ranges with Objective Criteria
A structured system benefits from precise and testable rules that determine when a range is present. Several approaches can be implemented without relying on discretionary judgment:
- Price containment tests. Define a lookback window and verify that price has remained within a percentile band of that window, subject to tolerances for minor overshoots that do not show continuation.
- Volatility contraction. Require that realized volatility over the window is below a threshold relative to its recent history. The threshold should be determined by research and should account for instrument characteristics.
- Touch frequency near boundaries. Quantify how often price approaches the upper and lower bounds. Ranges usually display multiple excursions toward each side without sustained progress beyond them.
- Time filters. Ensure that the range has persisted for a minimum number of observations to reduce the chance of mistaking ordinary fluctuation for structural consolidation.
Each criterion must be defined in measurable terms for testing. The system should specify how to update range boundaries as new data arrives, and when to declare the range invalid due to drift or expansion.
What Qualifies as a Breakout
Not every brief excursion beyond a boundary merits classification as a breakout. A systematic design typically includes confirmations that help separate meaningful transitions from transient noise. Examples of confirmation logic include:
- Magnitude relative to noise. The move beyond the boundary exceeds a measure of typical fluctuation.
- Persistence. Price remains beyond the boundary for a minimum time or number of observations, indicating that the excursion is not immediately rejected.
- Participation. Higher activity, broader market agreement, or related indicators that suggest new orders are joining the move rather than fading it.
These elements are selected and calibrated using data. They are not guarantees of success, but they improve the internal consistency of the strategy and its fit with the underlying logic of range transitions.
Strategy Archetypes within Ranging Breakout Designs
Several archetypes recur in systematic breakout strategies. All can be expressed as clear rules and tested.
- Immediate breakout continuation. The system conditions on a clean departure from the range and seeks to participate in the initial expansion. This design assumes that the first wave of movement often contains a large portion of the total move.
- Breakout and retest. After the initial departure, price revisits the former boundary from the other side. The system conditions on the retest holding and on evidence that the move is resuming. This design gives up some immediacy in exchange for added confirmation.
- Volatility squeeze release. The range coexists with compressed volatility. The system waits for a regime expansion signal along with the boundary exit, under the hypothesis that volatility expansion and directionality often coincide after prolonged compression.
- Session or time-box breakouts. For intraday systems, a fixed time window defines the range, and a subsequent break is treated as a structured catalyst. This design relies on the pattern of liquidity and information flow during the trading day.
Each archetype can be implemented at multiple horizons, from intraday to multiweek, and across liquid instruments. The intended holding period and costs of execution influence which archetype is viable.
Risk Management Considerations
A breakout approach faces two primary risks. The first is a false breakout, where price briefly escapes the range but fails to follow through. The second is a genuine breakout that reverses unexpectedly due to new information or a broad market shock. A structured system handles these through explicit risk controls that are designed in advance.
- Position sizing. Size should be calibrated to the volatility expected after a breakout and to the portfolio’s risk budget. Systems often scale exposure down when volatility rises or when correlations across positions increase. A fixed fraction of risk capital per trade is a common template, modified by the expected variability of returns.
- Exit discipline. Exits can be driven by invalidation, time, or trailing conditions. Invalidation exits cut exposure when the breakout thesis is no longer supported by price behavior, for example when price reenters and stabilizes within the prior range. Time based exits close positions after a specified period if the move has failed to develop. Trailing exits seek to retain participation while protecting against adverse reversals. These mechanisms should be defined without referencing specific price levels in this discussion.
- Gaps and event risk. Breakouts can coincide with scheduled announcements or unexpected news. Systems can include event calendars, reduced size during known risk windows, or rules that prohibit initiating new positions immediately before potentially disruptive releases.
- Transaction costs and slippage. Breakouts often occur during rapid repricing, which can widen spreads and increase price impact. Cost assumptions in testing should be conservative. Execution tactics should match the instrument’s liquidity profile.
- Serial correlation of outcomes. False breakouts can cluster. Drawdowns may contain sequences of small losses. Risk limits at the strategy or portfolio level, such as maximum daily or weekly loss thresholds, help maintain control during unfavorable market regimes.
Risk management shapes the realized distribution of outcomes more than signal quality alone. A breakout edge that is modest but consistent can remain viable when costs, volatility, and adverse clustering are controlled.
Volatility and Regime Context
Breakouts from ranges often mark a shift from a low volatility regime to a higher volatility regime. Incorporating explicit regime context into a systematic design can improve robustness.
- Pre breakout compression. Verify that the range reflects genuine compression rather than random drift. Compression can be quantified with relative volatility measures or with the ratio of price movement to its recent average.
- Post breakout expectations. The strategy should assume that the distribution of returns can widen after a breakout. Sizing, exit logic, and portfolio risk limits should reflect this possibility.
- Regime filters. Some systems avoid initiating breakouts during periods of extreme uncertainty or illiquidity, while others require confirmation from broader market indices, sectors, or risk indicators to reduce idiosyncratic noise.
Microstructure and Execution Nuances
Execution quality is a decisive component of breakout strategies, especially at shorter horizons.
- Liquidity and queue dynamics. When a boundary is broken, many participants may attempt to transact at similar times. Order queues can lengthen, and the probability of partial or delayed fills rises. Systems should be explicit about permissible order types and the conditions under which they are used.
- Spread and impact. Rapid moves widen spreads, and marketable orders can incur higher costs. Limit orders reduce immediate cost but may fail to execute when the market moves quickly. A hybrid approach that varies tactics by liquidity and urgency is testable and can be encoded in rules.
- Time of day patterns. In intraday contexts, opening and closing periods often combine higher volume with larger gaps and faster price discovery. The system may include time filters or distinct logic for these intervals, but any filter must be justified by data and implemented consistently.
High-Level Example of Strategy Operation
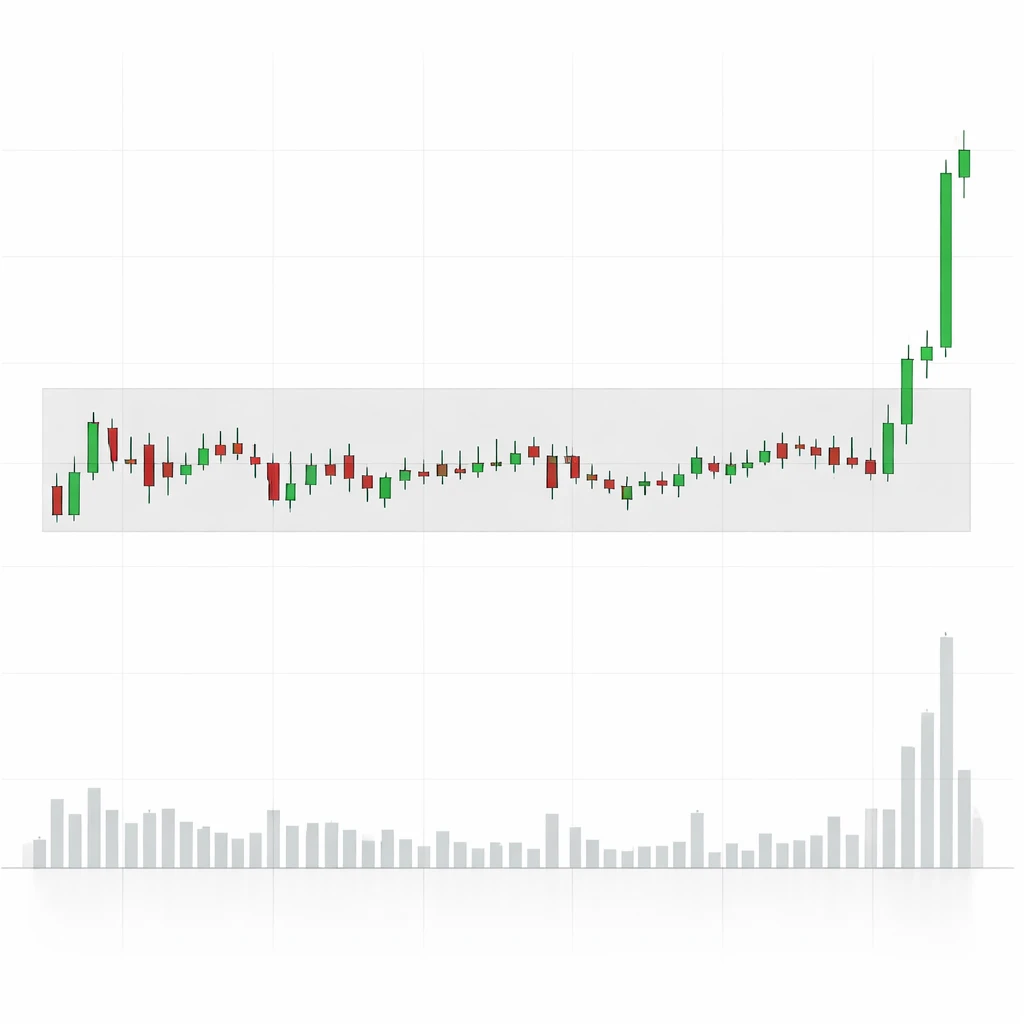
The following example illustrates how a breakout from a range can be handled in a systematic manner without prescribing signals or price levels. Consider a liquid index future that has spent several weeks oscillating within a relatively narrow band. Multiple tests of the upper and lower boundaries have occurred, volatility has contracted compared with the prior month, and activity has declined into the latter part of the consolidation.
The system identifies the range using rules that combine duration, depth, and compression. It continues to update the range endpoints as new data arrives, subject to a rule that prevents frequent redefinition to avoid reacting to noise. After the required minimum duration has elapsed, the system is eligible to respond to a break.
On a subsequent day, price moves beyond the defined upper boundary by a magnitude that exceeds a typical fluctuation measure. Activity increases above its recent average, and the move persists for a minimum number of observations that satisfy the system’s persistence test. A breakout condition is now classified as met.
The strategy considers three elements before acting, all of which were specified in advance:
- Participation criteria. The system requires both the magnitude and the persistence tests to be satisfied. If one is missing, the event is not classified as a breakout.
- Risk budget. The system queries the current portfolio state. If correlation across existing positions is elevated, the allowed exposure is reduced to remain within portfolio limits.
- Execution protocol. Given the observed increase in volatility, the system chooses an execution method appropriate to the instrument and liquidity context. Cost assumptions and slippage controls are applied as configured.
As the position evolves, two exit mechanisms stand ready. A time based exit will close the position if the anticipated expansion does not materialize within a defined window. An invalidation exit will close the position if price reenters the range and stabilizes there for longer than the permissible tolerance. If the move progresses, a trailing mechanism manages the open risk in a manner that allows participation while gradually reducing downside exposure.
Suppose that during the first session after the breakout, the market pauses and performs a shallow retest near the former boundary. Because the system’s rules require that the retest holds within a small tolerance and that persistence resumes in the direction of the break, the position remains open. Later, realized volatility rises relative to the compression phase, which was anticipated in the sizing model. After a pre specified period, the trailing mechanism reduces risk as the move extends. Eventually, either the time based exit or the trailing mechanism closes the position, depending on how the move unfolds.
This example demonstrates how clarity of definition and rule driven behavior allow the strategy to operate without discretionary decisions, while managing the primary risks associated with false breaks and execution costs.
Performance Characteristics and Expectations
Breakout strategies that focus on range exits typically have outcome patterns that differ from mean reversion approaches. Two characteristics are common:
- Many small losses and occasional larger gains. False breaks can produce modest losses, often in clusters. When a genuine trend emerges, gains can be larger and offset prior losses. Expectancy depends on the balance between win rate, average loss size, and average gain size after costs.
- Regime dependence. Extended sideways markets with frequent noise beyond boundaries can degrade performance, while environments with decisive transitions favor the approach. Robust design avoids heavy reliance on any single regime.
These characteristics should be validated through empirical testing. Analysts should focus not only on peak returns, but also on drawdown depth and duration, volatility of returns, dependence on a few large trades, and sensitivity to costs.
Integrating Breakout Logic into a Structured System
To function as a repeatable component in a broader program, the breakout module must follow a disciplined lifecycle from research to deployment.
- Specification. Document the range definition, breakout criteria, filters, sizing rules, exits, and execution protocols. Each element must be measurable and auditable.
- Backtesting and robustness checks. Use clean data and conservative cost assumptions. Segment history into distinct market regimes. Conduct walk forward testing, parameter stability analysis, and sensitivity checks. Avoid overfitting to a narrow window of history.
- Risk and capacity assessment. Estimate practical trading capacity given average liquidity and expected slippage. Establish portfolio level limits that account for correlation across instruments exposed to the same macro drivers.
- Implementation and monitoring. Build execution and risk dashboards, real time alerts, and post trade analytics. Verify that slippage, fill rates, and realized volatility remain within acceptable ranges. Review deviations between backtested and live results.
- Review and adaptation. Periodically reassess the strategy as market structure evolves. Adaptation should be cautious and based on sufficient evidence. Processes for model versioning and change control prevent ad hoc modifications from degrading reliability.
Filters and Complementary Signals
Filters can reduce false breaks at the cost of missing some valid moves. The trade off between selectivity and opportunity should be evaluated.
- Activity and participation. Requiring increased activity on a break can improve quality but may add delay. Thresholds must be set with an understanding of typical patterns for the instrument.
- Broad market confirmation. For single names, confirmation from sector or index behavior can reduce idiosyncratic noise. For indices, confirmation from related asset classes, such as credit or rates, may be informative.
- Time based filters. Avoid initiating immediately before low liquidity intervals or scheduled events unless the design specifically addresses those contexts.
- Structure validation. Require that the range was sufficiently tight and persistent to represent true compression rather than random fluctuation.
Complementary signals are not a substitute for clear breakout criteria, but they can refine selectivity when tested carefully.
Common Pitfalls
Implementations of breakout strategies often fail for avoidable reasons.
- Ambiguous definitions. Vague or subjective range and breakout rules hinder testing and lead to inconsistent live decisions.
- Optimizing to noise. Tuning parameters to maximize backtest performance across many variants can produce overfitting. Stability across nearby parameter values matters more than a single optimal number.
- Underestimating costs. In fast markets, realized slippage can exceed historical averages. Conservative assumptions and ongoing monitoring are essential.
- Ignoring risk clustering. False breakouts can cluster in certain regimes. Risk limits and capital allocation models should account for this serial correlation.
- Capacity mismatches. Attempting to apply a design that requires immediate execution to instruments with limited liquidity can degrade results.
Portfolio Context and Diversification
Breakout strategies behave differently from mean reversion or carry oriented approaches. Combining them can improve diversification if the correlations among strategies are low across regimes. Within the breakout family, diversification can be achieved by varying instruments, time horizons, and archetypes, provided that capacity and operational constraints are respected.
Portfolio level management should consider aggregate exposure to volatility expansions, macro catalysts, and correlated instruments. Controls can include limits on the number of concurrent breakout positions in the same sector or asset class, as well as dynamic scaling when systemic risk indicators rise.
Data Quality and Testing Integrity
Reliable conclusions require reliable data and careful methodology.
- Data accuracy. Verify corporate actions, contract rolls, and session boundaries for the instrument. Adjust data preprocessing consistently across the sample.
- Lookahead and survivorship bias. Ensure that boundary definitions and breakout classifications use information available at the time of decision. Avoid dropping instruments with poor outcomes from the sample.
- Robust metrics. Evaluate not only average returns, but also dispersion, tail behavior, and conditional performance around events. Use multiple performance metrics to avoid anchoring on a single measure.
Documentation and Operational Discipline
Structured systems benefit from strong documentation and routine. A breakout module should include a runbook that specifies daily checks, data integrity validations, event calendars, and escalation paths for anomalies. Post trade analysis should reconcile expected versus realized costs, identify slippage sources, and review whether exits behaved as designed during both quiet and volatile conditions.
Ethical and Practical Considerations
Strategies that rely on rapid movement must be mindful of market integrity and compliance obligations. Systems should avoid behavior that could be construed as manipulative, should follow exchange rules, and should respect limits on message traffic or order cancellations. Practical considerations include the resilience of infrastructure under load and the presence of backups for data feeds and order routing during periods of stress.
Concluding Perspective
Breakouts in ranging markets provide a disciplined way to align exposure with the market’s own transition from balance to imbalance. The approach does not depend on forecasting. It depends on clarity of definitions, robust controls, and careful execution. When integrated into a structured system with sound risk management, the strategy becomes a repeatable component that can be evaluated, maintained, and improved over time without discretionary intervention.
Key Takeaways
- Breakouts in ranging markets condition exposure on objective evidence that price has escaped a prior containment regime.
- Clear definitions of both range and breakout are essential for testing, execution, and risk control.
- Risk management focuses on controlling false breakouts, handling volatility expansions, and budgeting exposure across correlated opportunities.
- Execution quality and realistic cost assumptions strongly influence realized performance, especially around rapid moves.
- Robustness requires conservative testing, attention to regime context, and disciplined operational practices.