Breakout strategies seek to capture price movement that escapes a defined boundary or level and then persists with directional follow through. Breakouts across timeframes extend this basic idea by aligning information from multiple timeframes so that a breakout detected on one scale is evaluated within the structure of higher and lower scales. The goal is not to predict the future, but to frame opportunities in a disciplined way that is testable, repeatable, and compatible with risk controls.
Conceptual Definition
Breakouts across timeframes refers to a rules-based approach in which a trader defines a higher timeframe for structural context, an intermediate timeframe for pattern formation, and a lower timeframe for triggering and execution logic. A breakout is the event where price leaves a previously observed range or crosses a level that had contained price. The multi-timeframe element adds selectivity and structure. It attempts to distinguish moves that occur within noise on a single chart from moves that coincide with pressure built across several scales.
There are many ways to define a boundary. Examples include a prior swing high or low, a consolidation range, an opening range for a session, a moving or anchored average boundary, or volatility-based envelopes. The definition should be objective and consistent. A system should also specify how it recognizes that price has moved beyond the boundary in a non-trivial way. Some designers require persistence beyond the level, others require a minimum distance, and others require an increase in volume or volatility concurrent with the break. The specific thresholding is a matter of system design and testing rather than opinion.
Core Logic of Multi-Timeframe Breakouts
The logic rests on the observation that markets display nested structure. Trends, ranges, and turning points occur within larger trends, ranges, and cycles. A breakout on a lower timeframe has greater significance if the higher timeframe context indicates stored pressure in the same direction. Conversely, a breakout that occurs against higher timeframe structure tends to have a shorter expected life or more frequent failure, although that characteristic can itself be the basis of a different style of strategy.
What Constitutes a Breakout
A breakout is a transition from containment to expansion. Three dimensions are commonly used when formalizing this concept.
Space. Price traverses a meaningful distance beyond a defined level or range boundary. The distance can be framed in absolute price units, in volatility-adjusted units, or via percentage terms. The intention is to separate small probes from true escapes.
Time. The move persists for a non-trivial duration or closes beyond the boundary on the timeframe of interest. Persistence reduces sensitivity to transient spikes that revert quickly.
Energy. Market participation changes. Many practitioners observe that strong breaks often coincide with rising volume, broader market confirmation, or a shift in realized volatility. The system does not need all of these, but it should state which, if any, are required.
These dimensions can be combined in different ways. For example, a system might rely on space and time, or on time and energy. The choice is driven by testing and by the practical need to minimize ambiguity during live operation.
Alignment Models Across Timeframes
There are several structural ways to align timeframes without prescribing exact signals.
Top down alignment. A higher timeframe establishes directional bias or defines whether the system is open to breakout attempts in a given direction. An intermediate timeframe identifies a well-formed consolidation or level. A lower timeframe detects the actual escape from that structure. The top down model seeks to avoid fighting higher timeframe pressure, especially after prolonged contraction.
Bottom up alignment. A lower timeframe identifies an early impulse that has the potential to propagate. The intermediate and higher timeframes are then monitored for validation. If the move persists into a higher timeframe close or produces a new high or low on the higher timeframe, the initial signal is considered reinforced. This model is common when the holding period is shorter and the system emphasizes early entry and rapid risk control.
Bracket alignment. Some designs require a lower timeframe breakout to occur and then require the higher timeframe to confirm within a fixed evaluation window. If confirmation does not occur, the breakout is treated as failed and is classified accordingly in the system logs. This approach emphasizes explicit states and transitions, which aids post-trade analysis.
Building a Structured, Repeatable System
A repeatable breakout approach needs explicit definitions, state transitions, and data handling rules. Ambiguity is the enemy of reliable execution and evaluation.
Selecting Timeframes
One practical framework is to select three nested timeframes.
Anchor timeframe. Provides structural bias and regime definition. Examples include weekly for position holdings or daily for swing holdings.
Setup timeframe. Identifies ranges, flags, bases, or volatility contractions that may resolve. Examples include daily for position holdings or hourly for swing holdings.
Trigger timeframe. Detects the breakout event and manages entry logic and early risk. Examples include hourly for position holdings or several minutes for intraday holdings.
The specific combination depends on holding period, transaction costs, and data quality. What matters is that the ratios between timeframes are large enough that signals are not redundant. If the setup and trigger timeframes are too similar, then false precision increases without adding much informational value.
Defining Levels and Regimes
Levels should be derived through clear rules. A system might define a range using a rolling window of highs and lows, the first part of the trading session, or a distinct consolidation where realized volatility contracts relative to its recent average. Using an anchored reference such as an anchored average can also create objective zones. In all cases, the system needs a deterministic method for starting and ending the measurement window so that the definition is reproducible.
Regime identification supplements level definition. Regimes capture properties like expanding or contracting volatility, trending or mean-reverting conditions, and changes in liquidity. Breakouts that occur during contraction regimes tend to be more informative for continuation strategies. Breakouts during extreme volatility expansions may be more prone to whipsaw but can produce larger moves when they persist. Formalizing regime filters can reduce the number of discretionary decisions.
Confirmation Filters
Confirmation filters should be few and purposeful. Common filters include volume relative to a recent baseline, volatility expansion relative to a recent baseline, agreement with a broad index for single-stock strategies, and time-of-day windows that restrict when triggers can be acted upon. Restricting the number of filters helps control overfitting. Each filter should have a testable rationale.
From Detection to Execution Logic
To maintain repeatability, separate detection from execution. Detection defines when a breakout state exists on the trigger timeframe, given the setup context. Execution defines how orders are routed, which parts of the market microstructure are acceptable, and how slippage is modeled. The detection subsystem should output a concise state variable such as pre-breakout, breakout active, retest, or failed. The execution subsystem reads that state and applies simple rules for order placement, sizing decisions subject to risk limits, and exit handling. Encapsulation in this way allows changes to execution parameters without altering the core logic of breakout detection.
Data and Implementation Details
Data quality is central to any breakout system. Equities should reflect corporate actions. Futures need a clear roll methodology. Market hours and holidays need explicit treatment, especially for assets with overnight or fragmented sessions. Time zone handling, daylight saving transitions, and session gaps are common sources of subtle errors. Finally, define how outliers are treated. A single bad tick can create a false breakout if not filtered through basic plausibility checks.
Risk Management Considerations
Breakout strategies, especially those that escalate across timeframes, concentrate risk around transitions. Managing that risk requires explicit design choices that match the behavior of the strategy to the risk budget of the practitioner.
Position Sizing
Volatility-aware sizing is commonly used to normalize risk across instruments and regimes. A system may scale exposure using a recent volatility estimate, with caps to prevent excessive size during unusually calm periods and floors to avoid tiny positions during unusually volatile periods. Portfolio-level constraints such as maximum exposure by sector, asset class, or factor cluster help prevent inadvertent concentration.
Stop and Invalidation Logic
Breakout systems often include structural invalidation. If a breakout is defined as escape from a range, invalidation can be tied to a return into the range beyond a tolerance. Volatility-based stops trail price using recent range estimates. Time-based exits close positions that do not progress after a defined evaluation period. Each approach produces a different return distribution. Structural stops tend to have lower frequency but larger losses when they occur. Tight volatility stops produce higher frequency small losses with the possibility of truncating winners. Time-based exits limit capital tie-up but can cut off slow trends. Many systems combine these ideas so that a position has both structural invalidation and a time limit.
Gaps, Slippage, and Liquidity
Breakouts often coincide with liquidity imbalances. Slippage can be largest when the market moves through the level. Backtests that assume fills at recorded prices without modeling the bid-ask side can be overly optimistic. Including realistic assumptions about queue position, partial fills, and order types can significantly change results. Overnight gaps can invalidate stops on open or produce favorable outcomes that a system cannot consistently capture. The design should state how gaps are treated and how overnight risk is limited.
Correlation and Exposure
When multiple symbols share drivers, simultaneous breakouts can cluster. This clustering inflates portfolio volatility even if each position is sized prudently. Exposure controls can limit the number of concurrent positions within a theme or reduce size when the number of correlated signals increases. Timeframe overlap matters as well. If a system uses the same higher timeframe across multiple assets, many triggers may align by construction. That property is not inherently good or bad, but it should be recognized and managed.
Event and Regime Risk
Scheduled events such as earnings releases, economic reports, or policy announcements can change the behavior of breakouts. Some systems exclude trading around these events or adjust parameters. Regime shifts, such as transitions from low to high volatility regimes, can affect hit rates and average runs. Building regime awareness into risk controls helps maintain performance characteristics that match expectations.
High-Level Operating Example
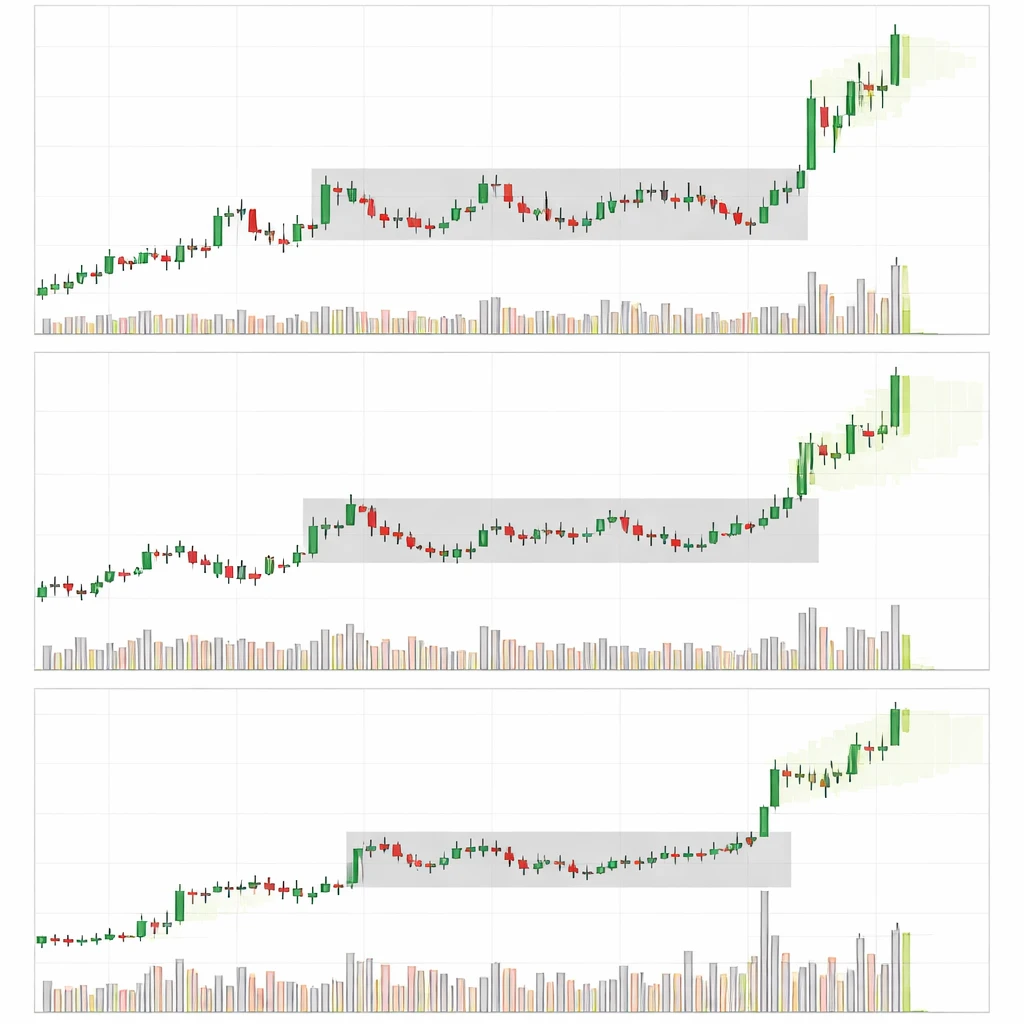
Consider a strategy that structures decisions around three timeframes. The weekly chart defines structural bias. The daily chart identifies consolidations. The hourly chart provides breakout detection and early management. Suppose the weekly trend has been upward for several months with orderly pullbacks. On the daily chart, price has compressed into a narrow range with several touches of the same upper boundary and declining realized volatility. The hourly chart shows repeated approaches to the daily boundary with decreasing dips, suggesting accumulation below the level.
In this scenario, a system might mark the daily range and set a rule that a breakout state is active on the hourly chart if price pushes beyond the daily boundary with specified persistence or distance. Once a breakout state is active, the system tracks whether the move continues into the daily close, whether volume increases relative to its recent baseline, and whether the next daily session holds above the boundary. If these observations meet the system’s definitions of follow through, the system remains in continuation state. If price returns into the prior range beyond tolerance, the system enters failed breakout state and follows its invalidation rules.
This example illustrates how lower timeframe action is nested in higher timeframe context without prescribing any particular signal. The weekly chart supplies directional context. The daily chart supplies the structure to break. The hourly chart supplies timeliness and the ability to control initial risk. The system clearly separates detection, state changes, and risk handling. Outcomes are classified into continuation, retest-and-go, or failure. Over time, this classification allows the builder to evaluate which states contribute most to returns and which require tighter controls.
To make the example more concrete, imagine that after the hourly breakout the daily session closes above the range. The next session opens with a small gap above the boundary and trades sideways for several hours before pushing higher. This produces a breakout cascade. A move that began on the hourly chart survives to the daily close and registers a new high on the weekly chart by the end of the week. Such cascades are the ideal scenario for continuation-oriented breakout systems because multiple participant groups validate the move across scales. In contrast, if the daily session had closed back inside the range, the event would be categorized as a failed attempt, and the system’s exit or de-risk logic would take effect according to its predefined rules.
Variations within the Breakout Family
Breakouts across timeframes form a broad family of strategies rather than a single blueprint. The following variations are common within disciplined systems.
Continuation after contraction. This variant focuses on consolidations within established trends. The higher timeframe bias is aligned with the direction of the break, and the system emphasizes events that emerge after a measurable decline in realized volatility. Many such systems attempt to capture the initial expansion leg and then reduce exposure once momentum wanes.
Base breakouts after prolonged balance. When a market builds a base across multiple timeframes, the eventual break can have long duration. The multi-timeframe element appears when a lower timeframe resolves first and then sustains into higher timeframe closes, registering regime change in the process. Because bases can be wide, these systems often rely on volatility-aware sizing.
Opening range alignment. For intraday strategies, the opening range provides a standardized window for defining initial balance. A breakout through this range that coincides with a higher timeframe tilt or with a prior day’s structural level is one way to add context without discretion. Time-of-day filters and liquidity considerations are central to this variant.
Reversal breakouts at extremes. Not all breakouts are continuation. A failed breakdown from a weekly support area that forms a daily base and then breaks upward on the intraday chart can be classified as a reversal breakout across timeframes. The logic is symmetric. The system still defines a boundary, waits for escape criteria, and enforces risk rules. The difference is the direction of travel relative to the prior move.
Testing and Evaluation
Breakout systems are sensitive to implementation details. Proper testing is therefore as important as defining the setup itself.
Sample Definition and Walk-Forward Design
Time series data are non-stationary. Using chronological splits, such as an in-sample period followed by a forward test, is more appropriate than random shuffles. Anchored walk-forward analysis can be helpful. In this approach, the system is calibrated on a historical window and then applied to the next window without changes. The window is then rolled forward and the process repeats. This method reveals whether the strategy adapts reasonably to new conditions without frequent re-tuning.
Execution and Slippage Modeling
Because breakouts concentrate trading around transitions, the difference between printed prices and achievable prices matters. A realistic model includes bid-ask spreads, partial fills during fast moves, and latency in reacting to triggers. Backtests that assume immediate fills at the breakout price can be misleading. Adding simple slippage models that scale with volatility and liquidity improves realism and tends to dampen overly optimistic results.
Metrics and Diagnostics
Average return per trade and hit rate are not sufficient diagnostics. Consider the distribution of run-up and drawdown per position, average holding time, and how performance changes across volatility regimes. Examine sequences of trades to assess dependency on a small number of outsized winners. Evaluate sensitivity to parameter choices such as range window length, persistence criteria, and filter thresholds. Sensitivity analysis helps distinguish robust structure from curve fit.
Error Taxonomy and Logging
A clear taxonomy of outcomes supports continuous improvement. Examples include clean break and trend, break that retests the level before continuation, break that fails promptly, and break that stalls without invalidation. Each category can be associated with statistics such as average profit or loss, variance, and time in trade. Logging should include the state of relevant filters and execution metrics. These records allow post-event analysis to determine whether a rule change improves reliability or simply fits a past artifact.
Regime Awareness and Adaptation
Non-stationarity is a defining feature of markets. Some periods reward breakout measures built on narrow ranges and quick follow through. Other periods generate frequent false breaks. A system can adapt either by changing its parameters slowly as new data accrue or by switching among a small set of predefined parameter sets when simple regime criteria are met. Frequent tinkering based on short windows tends to embed hindsight. Slow, rules-based adaptation is easier to test and verify.
Practical Implementation Notes
Implementation details often determine whether a theory holds in practice.
Market selection. Instruments differ in liquidity, gap behavior, and susceptibility to news shocks. Align the system’s assumptions with the instrument’s microstructure. For example, intraday strategies on illiquid small caps or thin futures contracts face different risks than strategies on liquid index instruments.
Session definitions. For assets that trade around the clock, define which session data drive level construction and which session data drive triggers. Many systems build levels on regular-session data and use extended hours only for monitoring. The choice should be explicit and consistent.
Corporate actions and rolls. Adjusted equity data and a clear futures roll method prevent artificial breaks at ex-dividend dates or contract transitions. These events can create or erase ranges mechanically if not handled.
Automation and oversight. Even automated systems benefit from human oversight. Logging, alerting on state changes, and post-trade review preserve the integrity of the process. If discretionary overrides are permitted, document the rationale and evaluate their impact separately to avoid contaminating testable results.
Complexity control. It is tempting to add many filters to reduce false signals. Each filter should add measurable value net of costs. A lean rule set that handles detection, execution, and risk with clarity is easier to maintain and audit. Excessive complexity makes it hard to diagnose performance shifts.
How Breakouts Across Timeframes Fit into Systematic Design
At its best, a multi-timeframe breakout strategy serves as a building block within a larger framework. It can be one module in a diversified portfolio of uncorrelated systems that exploit different edges. Breakouts capture expansion after containment. Other modules may focus on mean reversion, carry, or relative value. Combining modules that rely on different drivers can stabilize portfolio-level equity curves.
Within the breakout module, the multi-timeframe approach supplies structure. The anchor timeframe defines where expansion is most likely to be rewarded, the setup timeframe defines where containment is clearly observable, and the trigger timeframe handles the granular mechanics of initiating and managing risk. This decomposition helps with research, implementation, and governance. Each component can be improved independently while preserving the coherence of the whole.
Common Pitfalls and How to Avoid Them Conceptually
Several mistakes recur when building breakout systems. Ambiguous definitions lead to discretionary interpretation. Overfitting to a small set of past breakouts creates brittle rules. Ignoring execution cost and slippage inflates apparent profitability. Conflating detection and execution makes it difficult to test alternatives to order handling. Treating correlated signals as independent underestimates risk. Each pitfall is addressed by the principles outlined above. Write explicit rules, evaluate them under walk-forward testing with realistic costs, keep modules separate, and manage exposure at the portfolio level.
Conclusion
Breakouts across timeframes are a disciplined way to translate the idea of expansion after containment into a rules-based process. The approach uses higher timeframe structure to add context, an intermediate timeframe to define containment, and a lower timeframe to detect and manage the transition. Risk management is integral, not an afterthought. Stops, position sizing, and portfolio constraints shape the distribution of outcomes as much as signal definition. When implemented with clear rules, tested with realistic assumptions, and monitored with rigorous logging, a multi-timeframe breakout strategy can function as a robust component within a broader systematic program.
Key Takeaways
- Multi-timeframe breakouts align higher timeframe context, intermediate containment, and lower timeframe triggers to reduce ambiguity and improve discipline.
- Breakout definition should specify space, time, and energy dimensions in objective terms that are testable and reproducible.
- Risk management choices, including volatility-aware sizing, structural invalidation, and portfolio exposure controls, shape outcomes as much as detection logic.
- Realistic execution modeling and walk-forward testing are essential because breakouts concentrate trading during transitions where slippage is highest.
- Classifying outcomes and maintaining detailed logs enables continuous improvement without overfitting, preserving the integrity of a repeatable system.