Volume and volatility occupy a central place in technical analysis because they provide information about market participation and the variability of price. They are often used to confirm or question what price alone appears to be signaling. Yet neither metric is self-explanatory, and both can mislead when read without context. The concept of limitations of volume and volatility focuses on recognizing where these measures fail, distort, or lag, and how those shortcomings appear on charts. The purpose is interpretive clarity rather than prediction. Understanding these constraints helps one avoid giving unwarranted weight to signals that are weak, ambiguous, or structurally biased.
What the Concept Means
Limitations of volume and volatility refers to the practical boundaries on what these measures can reliably indicate about price behavior. In specific terms, it covers three broad issues.
First, measurement is imperfect. Volume can be fragmented across venues or reported with delays; volatility depends on the estimation window, sampling frequency, and whether gaps are included. Second, context matters. A high volume day in August does not have the same informational content as a high volume day during a central bank decision. A tight volatility regime in a range-bound equity index differs materially from a tight regime in a commodity ahead of a supply report. Third, market structure changes over time. The rise of off-exchange trading, exchange-traded derivatives, and algorithmic market making has shifted how volume and volatility manifest in prices, reducing the stability of historical relationships.
What Volume Represents, and What It Does Not
Volume is a count of transactions over a period, often shares or contracts traded. It is sometimes aggregated as notional value. In decentralized markets such as spot FX or certain crypto venues, what is displayed may only represent a subset of total activity, or it may be a proxy like tick volume. Even in listed markets, consolidated feeds can miss off-exchange dark activity or late prints. Corporate actions, contract rolls, and index rebalances can create jumps in volume that reflect administrative shifts rather than a change in conviction.
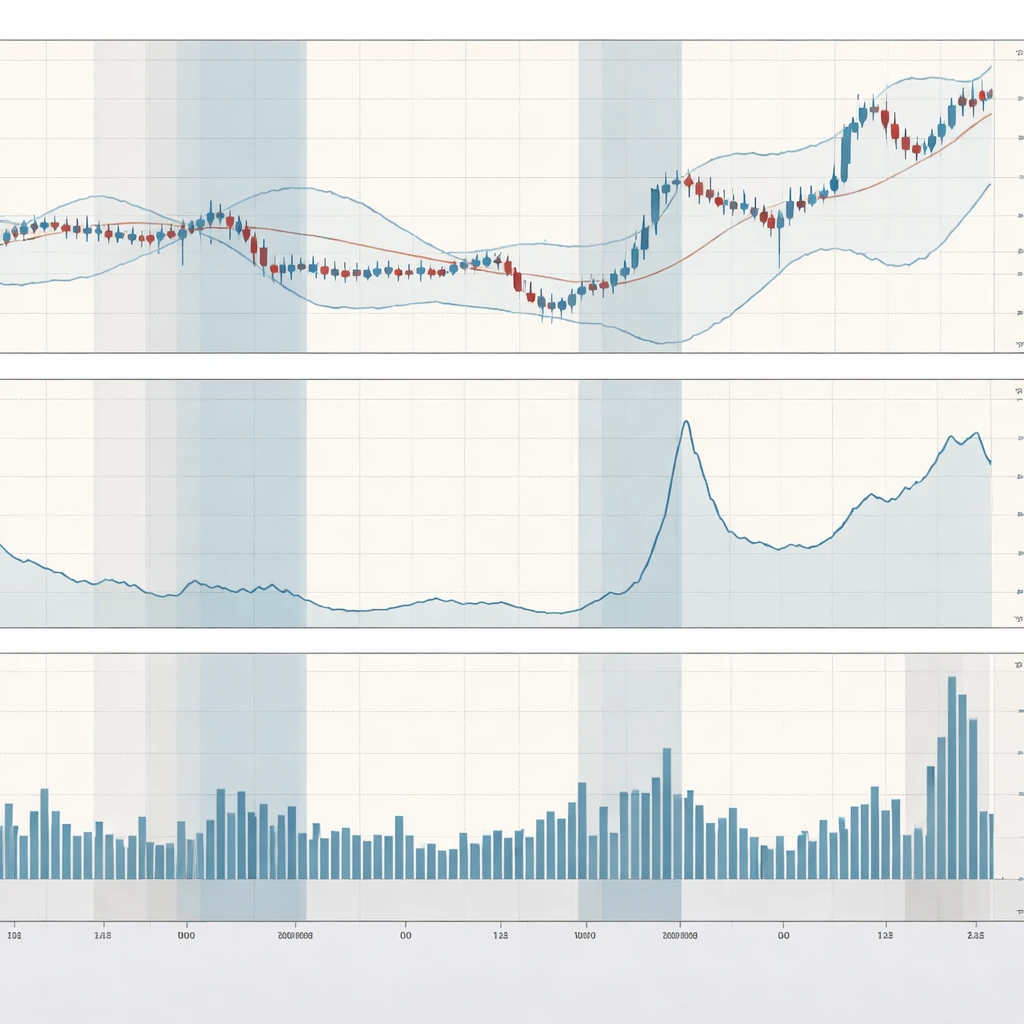
On a chart, these limitations appear visibly. Volume histograms at the bottom of a daily price chart often show troughs during holiday weeks and peaks around earnings or macro events. Those patterns are not necessarily informative about trend quality. Similarly, futures charts frequently display a surge in activity when the market rolls to the next contract month. The roll migrates activity from the expiring contract to the new lead month, producing a sharp rise in displayed volume without any change in underlying demand to buy or sell the asset itself.
What Volatility Represents, and What It Does Not
Realized volatility is a statistical summary of how much price varies over time. Common chart-based proxies include Average True Range, standard deviation bands, and historical volatility calculated over a rolling window. Implied volatility, often accessed through options markets, reflects the market’s expectation of future variability. Both realized and implied measures are path dependent and sensitive to the lookback period, sampling scheme, and inclusion of price gaps. They are not direct measures of risk appetite, trend strength, or liquidity, although they are often interpreted that way.
On a chart, the limitations appear as erratic expansions and contractions of bands or ranges that are detached from subsequent price continuation. A narrow Bollinger Band configuration does not guarantee an imminent directional move. A spike in ATR after a gap may reflect a one-off repricing rather than the start of a sustained higher-volatility regime. When windows are short, estimates swing excessively; when windows are long, the indicator can lag behind regime shifts.
How Limitations Appear on Charts
Volume signatures that can mislead
Several recurring chart configurations highlight where volume can be misread.
Holiday and session effects. Daily equity charts often show volume collapsing around late December or during summer vacation periods in some markets. A price breakout during such a low-participation window may look suspect when judged by classical heuristics that seek confirmation from volume, yet the low reading is seasonal rather than uniquely relevant to that breakout.
Contract roll distortions. In commodity futures, a dramatic surge in volume often accompanies the transition to the next delivery month. If a chart overlays continuous volume without proper adjustment, the spike can be interpreted as a renewed conviction when it may simply be the result of volume migration. Price may be flat or drifting even as the histogram jumps.
Corporate actions. Stock splits, buybacks, or index inclusions can alter trading mechanics. A stock split frequently increases the number of shares traded because the nominal price is lower and smaller lots are more accessible. The charted volume increases, but the economic meaning is not a shift in belief about fundamentals or trend quality.
Fragmented liquidity. For assets with significant dark-pool or off-exchange activity, the displayed volume can lag or understate true turnover at critical moments. A sharp intraday move may occur with apparently modest printed volume because a significant portion executed away from the visible book. The volume indicator understates participation at the moment when context matters.
Volatility signatures that can mislead
Noise-driven compressions. Prolonged low-volatility periods can appear on charts as narrow ranges or tight bands. In some environments this reflects genuine stability. In others it is the byproduct of event risk being suppressed temporarily by a known catalyst date. The compression signals little about direction or timing because variance is being deferred, not removed.
Gap inflation. A single large gap following a news event inflates rolling measures of realized volatility and ATR. The indicator stays elevated for several sessions even if intraday movement subsides. The chart suggests a high-volatility regime, yet the underlying process has already calmed.
Window and sampling bias. Changing the lookback from 14 periods to 20 periods or shifting from close-to-close to high-low ranges produces noticeable differences in the indicator path. What appears as a rising volatility regime on a 10-day window may be flat on a 30-day window. The chart does not resolve which is more meaningful without external context.
Why This Concept Matters to Technical Readers
Technical readers focus on the limitations of volume and volatility to avoid overconfidence in signals that can fail without warning. Price patterns often invite confirmation from these measures. A breakout supported by high volume or a trend accompanied by stable, moderate volatility is conventionally seen as stronger. The limitation is that confirmation can be spurious when the underlying data is distorted or lagging. Recognizing when the data are informative versus when they are contaminated by schedule effects, microstructure changes, or estimation choices allows for a more nuanced interpretation of price behavior.
Attention to limitations also reduces the risk of attributing causality to what are, in effect, sampling artifacts. A trader who understands that off-exchange prints can mask true participation will be cautious about dismissing a move as unconfirmed. Similarly, awareness that volatility tends to cluster after large shocks prevents misreading a single expansion as a durable long-term shift.
How Limitations Arise: Measurement and Microstructure
Data coverage and consolidation
Most charting platforms rely on consolidated feeds that merge activity across venues. Merging can introduce timing issues, double-counting, or omission of late reports. In equities, off-exchange execution can exceed a third of total volume in certain periods. If your chart only displays lit market prints, the histogram can understate activity during the hours when it matters most.
Tick volume proxies
In markets without centralized reporting, tick volume counts the number of price changes as a proxy for turnover. Tick counts correlate with activity but do not measure size. A rapid series of small quotes can inflate the proxy compared with slower blocks that move the market more. On a chart, tick volume can spike in choppy, low-depth markets without indicating meaningful participation.
Corporate events and index mechanics
Corporate actions change denominators and trading preferences. Index reconstitutions temporarily boost turnover as passive vehicles rebalance. These flows are mechanical, not opinion-driven. A daily chart may show a burst of volume into the close on a reconstitution date. The timing and size are based on index rules rather than a new view of value.
Futures term structure and delivery constraints
The volume profile across futures maturities shifts as the front month approaches expiration. A continuous chart that attaches volume to the active contract will show a staircase pattern. Without annotations, that pattern can be mistaken for renewed conviction each time activity jumps. The change reflects liquidity migrating forward, not new information about price direction.
Volatility Estimation Choices and Their Consequences
Lookback length and responsiveness
Short lookbacks are responsive but noisy; long lookbacks are smooth but slow. On a chart, a 10-day historical volatility series will rise quickly after a shock, then decay. A 60-day series may barely move at first, then remain elevated long after conditions have normalized. Neither is right or wrong, but reading one in isolation can misstate the state of the market.
Range-based versus close-to-close metrics
ATR incorporates intraday highs and lows, capturing overnight gaps and daytime extremes. Close-to-close volatility ignores intraday swings. In trend days with steady one-direction movement, close-to-close can appear high while ATR is moderate if there are few pullbacks. Conversely, erratic mean-reverting days can lift ATR while close-to-close remains tame. The charted choice shapes the narrative.
Gaps and calendar effects
Assets that trade around the clock exhibit different gap dynamics than assets with fixed sessions. Equity index futures that trade overnight will absorb information continuously and often gap less at the open than single-name equities that only print during regular hours. A daily ATR on the latter can be dominated by opening gaps during earnings season, producing a misleading impression of sustained intraday turbulence.
Contextual Drivers: When Volume and Volatility Decouple from Price
There are periods when price trends despite low volume, and others when volume surges without directional progress. Volatility can expand in sideways markets and compress in trending ones. These decouplings are not anomalies. They reflect the interaction of liquidity provision, hedging flows, and event timing.
Trend with low volume. In equities, a steady advance can occur during a buyback blackout where participation narrows and liquidity providers shade quotes. The advance is real, but the volume histogram looks subdued. Treating that as a weak trend solely due to low volume ignores the structural drivers that temporarily reduce turnover.
Sideways with high volatility. Ahead of a macro announcement, price can whip around within a well-defined range as participants balance risk, elevating realized volatility without any change in the medium-term path. A chart-based volatility indicator rises, but the significance is limited to risk around the event, not a shift in the longer narrative.
Practical Chart-Based Contexts and Examples
Example 1: A low-volume breakout during a seasonal lull
Consider a broad equity index on a daily chart in late August. The price closes above a multi-month range with a modest uptick in volume, but the histogram remains well below the quarterly average because many participants are inactive. A traditional reading might discount the breakout as unconfirmed. Two weeks later, as participation normalizes, volume returns to average levels without a commensurate price reversal. The initial low-volume reading reflected seasonal absence rather than absence of conviction.
On the chart, the limitation is visible as a mismatch between a meaningful price move and a muted volume bar. Understanding the calendar reduces the likelihood of drawing strong conclusions from that mismatch.
Example 2: Contract roll creating an apparent volume surge
Take a commodity future approaching first notice day. The front-month contract’s volume declines while the next-month contract’s volume rises. A continuous chart that splices contracts may show a sudden jump in volume concurrent with a minor price fluctuation. The visual suggests renewed interest at that price level, but the jump is simply liquidity migrating to the new benchmark. An unadjusted volume oscillator could register a positive shift that lacks informational content.
Example 3: Volatility spike driven by a single gap
Imagine a single-stock daily chart around an earnings release. The day after the report, the stock gaps down 7 percent and then trades in a narrow range. An ATR-based indicator jumps and stays high for several sessions. If one infers that the market has entered a persistent high-volatility regime, subsequent quiet trading may contradict that. The indicator is elevated because it still includes the gap day in its window. On the chart, the limitation appears as a slow decay of ATR that overstates the ongoing level of disturbance.
Example 4: Crypto weekend volume and thin depth
On a 4-hour chart of a widely traded crypto asset, weeknights and weekends display higher percentage moves with relatively low printed volume. Liquidity is thinner, and a small number of large orders can cause outsized price swings. A volume divergence indicator may mark these moves as weak. Yet the magnitude of price change reflects depth conditions rather than broad participation. Without acknowledging the session and venue, the chart invites a misread of conviction.
Common Misinterpretations to Avoid
Assuming volume validates direction universally. A price advance on high volume can be dominated by short covering rather than new long initiation. The histogram is large, but the composition of flow differs from the interpretation that buyers are aggressive.
Treating low volatility as stability across contexts. Low realized volatility in a tight range ahead of an event can be a pause rather than a signal of risk abatement. The market may be compressed by hedging activity or awaiting information.
Ignoring microstructure changes. A shift in tick size, market hours, or liquidity provider incentives can alter the behavior of both volume and volatility. Old indicator thresholds may no longer be appropriate when the environment changes.
Overfitting indicator settings. Selecting the lookback window that best explains recent behavior can create a misleading sense of reliability. The chart appears to confirm a hypothesis because the parameters were tuned to the sample.
Instrument-Specific Nuances
Equities
Corporate actions, index membership, and off-exchange trading materially affect how volume displays on charts. Earnings seasons compress and then expand realized volatility in predictable cycles tied to reporting cadences. Regular-hours trading differs from overnight moves; a daily bar may conflate the two.
Futures
Contract rolls and delivery constraints shift liquidity through time. Calendar spreads impose structure on intraday variance that can elevate volatility without directional intent. Exchange-set price limits can produce abrupt ATR spikes that represent mechanical boundaries rather than organic volatility.
FX
Decentralized trading means tick volume proxies are common. The London and New York overlaps show different volatility characteristics than Asia-Pacific hours. A chart that does not differentiate sessions can misstate the usual relationship between movement and participation.
Crypto
Venue quality varies, and reported volume can be inconsistent. Depth thins outside peak hours, producing larger percentage moves on fewer trades. Perpetual swaps introduce funding cycles that can concentrate activity at predictable times, distorting how volume and volatility align with price.
Options-linked effects on underlying
Implied volatility from options markets can feed back into the underlying through hedging activity. Around option expirations or when large strikes are in play, realized volatility patterns may reflect hedging flows as much as information. Reading the underlying’s volatility in isolation may miss this driver.
Timeframe Dependence
The meaning of a volume or volatility observation depends on timeframe. Intraday patterns often follow a U-shape in equities, with higher activity at the open and close. Reading a midday breakout as weak due to low volume can be a category error if midday is normally quiet. At weekly or monthly horizons, the same move may read differently because turnover accumulates and volatility smooths.
Similarly, volatility clustering manifests at multiple horizons. A burst of 5-minute volatility during the opening auction can dissipate within an hour. On a daily chart, that burst barely registers. Conversely, a daily gap that never fills dominates a rolling 10-day ATR but may have little bearing on 5-minute tape behavior.
Interpreting Price with Awareness of Limitations
The practical goal of studying limitations is not to discard volume and volatility, but to frame them correctly. Two guiding ideas help maintain perspective.
Corroboration is conditional. Volume and volatility corroborate price only when the underlying measurements are relevant to the context. The same histogram height or band width can carry very different meanings depending on seasonality, venue coverage, or upcoming events.
Indicators are abstractions. Any chart-based measure compresses information. ATR condenses the distribution of ranges, historical volatility condenses return variance, and volume compresses a complex flow mix into a single bar. Abstractions are useful, but they cannot reveal composition, motives, or future path on their own.
Practical Checks for Chart Readers
The following checks do not prescribe strategies. They are safeguards for interpretation that reduce the risk of overreading noisy signals.
- Identify calendar influences such as holidays, earnings schedules, and major data releases that can depress or inflate volume and volatility mechanically.
- Note market structure features including contract rolls, index rebalances, trading halts, and off-exchange activity that can decouple displayed metrics from underlying participation.
- Compare multiple volatility proxies, such as ATR and a rolling standard deviation, to gauge sensitivity to estimation choices.
- Consider session segmentation where relevant. Regular-hours bars tell a different story than around-the-clock bars for many assets.
- Be cautious about single-bar inferences. One gap or one high-volume candle often dominates the indicator window without establishing a durable regime.
How This Concept Helps Interpret Price Behavior
When the limitations of volume and volatility are front of mind, price action is read with greater discipline. A price move is not automatically upgraded or downgraded based on a single confirmation indicator. Instead, the reader asks whether the displayed volume truly reflects broad participation, and whether the volatility measure is representative of ongoing conditions rather than a transitory spike or compression. This framing shifts attention toward structure and away from simplistic heuristics.
That shift has pedagogical value. It promotes analysis that is conditional, evidence-based, and transparent about uncertainty. It also supports clear communication. Rather than stating that a move is strong because volume was high, an analyst can say that volume was elevated relative to its seasonal baseline with known mechanical contributors, and therefore the informational content is mixed. The chart becomes a starting point for inquiry rather than a conclusion.
Limitations of the Limitations
Even a careful accounting of constraints cannot eliminate ambiguity. Some distortions are unobservable in real time. Off-exchange volume may only be reported with a lag; option-driven hedging may not be directly visible without specialized data. Furthermore, markets adapt. As participants learn to watch certain indicators, behaviors evolve, weakening previously reliable associations.
Recognizing these meta-limitations encourages modesty in inference. Volume and volatility remain valuable, but their value is conditional. A chart can show that a move is occurring with atypical participation or variability. It cannot specify causation or persistence without external information.
Concluding Perspective
Volume and volatility are integral parts of technical analysis, yet each carries interpretive traps. On charts, volume is shaped by seasonality, venue fragmentation, corporate and index mechanics, and futures roll behavior. Volatility is shaped by estimation choices, gaps, clustering, and event timing. The limitations of these measures are not reasons to ignore them. They are reasons to anchor chart reading in context and measurement awareness. With that anchor, price behavior is interpreted with fewer false narratives and a clearer sense of what the data can, and cannot, say.
Key Takeaways
- Volume and volatility offer useful context for price, but both are prone to structural distortions, lags, and sampling biases that appear directly on charts.
- Displayed volume can understate or overstate participation due to holidays, off-exchange activity, corporate actions, and futures contract rolls.
- Volatility indicators depend heavily on lookback windows, sampling choices, and gap treatment, which can inflate or mute perceived regime changes.
- Context determines meaning. The same histogram or band width can imply different things across assets, sessions, and event cycles.
- Interpreting price with awareness of these limitations reduces overconfidence and helps avoid attributing significance to signals that are mechanical rather than informational.