Overview and Definition
Trend exhaustion signals are observable patterns in price, volume, momentum, and market structure that suggest a prevailing trend is losing strength. They do not guarantee reversal. Instead, they indicate that the conditions that sustained the trend are weakening, which often precedes a pause, a shift to range-bound behavior, or a potential change in directional bias. The core idea is simple. Trends require persistent directional pressure and participation. As the underlying participation or pressure wanes, the trend ages and becomes more fragile.
In technical analysis, exhaustion is assessed probabilistically across multiple dimensions. No single feature is decisive. Traders watch for a confluence of evidence such as loss of momentum, volume anomalies, diminished range efficiency, failed breakouts or breakdowns, and subtle changes in swing structure. Understanding these signals helps interpret price behavior within the broader framework of market structure without implying any specific action.
Exhaustion Versus Reversal
It is useful to distinguish between exhaustion and reversal. Exhaustion describes the weakening of trend conditions. Reversal describes a completed transition to a new directional trend. Exhaustion can lead to consolidation or prolonged drift before any structural reversal appears. Many trends show exhaustion signals multiple times during their lifespan, followed by brief pullbacks and renewed continuation. For this reason, exhaustion should be interpreted as a diagnostic of trend health rather than a prediction of immediate directional change.
How Exhaustion Appears on Price Charts
Charts often express exhaustion through a combination of price action features. The following patterns are commonly studied in the literature and by practitioners. None of these, in isolation, is definitive.
Candlestick and Bar Features
- Long wicks near trend extremes. In an uptrend, a bar with a long upper shadow that fails to close near the high suggests that intraday buying pressure faced intense selling into the close. A cluster of such bars can imply buyer fatigue. In a downtrend, long lower shadows may indicate selling pressure meeting demand.
- Doji clusters and small real bodies. A sequence of indecisive bars following a persistent advance or decline reflects contraction in net directional progress. Persistence of such bars at trend highs or lows can signal stalling.
- Wide range bar without follow-through. A sudden expansion in range that is not confirmed by subsequent progress can be a late-stage surge rather than a sustainable breakout. The absence of follow-through is the key element.
Gaps and Throw-overs
- Exhaustion gaps. In a mature uptrend, a gap up that is quickly filled within one or two sessions can indicate a final burst of enthusiasm that fails to attract incremental demand. In a mature downtrend, a gap down that reverses and fills quickly can indicate capitulation without sustained supply.
- Throw-over above a channel. Price thrusting above the boundary of a rising channel, only to slip back inside within a short window, suggests a brief overextension. The same logic applies to a throw-under below a falling channel.
Range Efficiency and Extension Failure
- Diminishing range on pushes in the trend direction. If each new high in an uptrend is achieved by smaller and smaller marginal extensions, the trend’s efficiency is declining. The same holds for diminishing marginal lows in a downtrend.
- Range extension failure. When intraday highs fail to exceed prior highs despite early strength, or intraday lows fail to undercut prior lows despite early weakness, it reflects an inability to extend in the trend direction.
Momentum and Non-confirmation
Momentum indicators translate price changes into rate-of-change signals. Exhaustion frequently shows up as non-confirmation, where price records a new extreme but momentum does not.
- Bearish divergence in an uptrend. Price prints a higher high while a momentum oscillator such as RSI, MACD histogram, or a rate-of-change series forms a lower high. The message is that the most recent advance required less momentum than prior advances.
- Bullish divergence in a downtrend. Price prints a lower low while momentum forms a higher low. This reflects a deceleration in the pace of decline.
- Momentum failure swings. An oscillator fails to exceed a prior oscillator high on a price breakout, or fails to undercut a prior oscillator low on a price breakdown. This is a nuanced variation of divergence that highlights a shift in the internal rhythm of the trend.
Non-confirmation does not imply that a top or bottom is in place. Divergences can persist. The analytical value lies in recognizing that the mechanical energy of the move is weaker, which raises the probability of stalls or structural tests.
Volume, Participation, and Climax Behavior
Volume is often treated as a proxy for conviction and participation. Exhaustion can appear as either a drying up of participation on trend continuation or a sudden climax in activity.
- Decreasing volume on trend advances. In an uptrend, if rallies to new highs occur on progressively lower volume, incremental demand may be weakening. The same principle applies to new lows on diminishing volume in a downtrend.
- Volume climax near extremes. A large spike in volume accompanying a dramatic move that fails to persist can reflect capitulation or final enthusiasm. The key is the subsequent lack of continuation. Without that context, a spike can also be a healthy expansion in participation.
- On-balance volume (OBV) non-confirmation. If OBV fails to confirm new price highs or lows, it indicates that volume flow is not aligned with price extension.
Breadth and Cross-sectional Confirmation
For indices and broad markets, cross-sectional participation matters. A trend can weaken even while the headline index makes new highs or lows if fewer components participate.
- Advance-decline breadth divergence. The index records a new high while the advance-decline line fails to confirm or trends down. This suggests narrowing leadership.
- New highs versus new lows. Deterioration in the number of stocks making new highs during an index advance signals reduced breadth. Analogous logic applies in declines.
- Sector rotation and lag. When defensive sectors outperform late in an index uptrend, some practitioners view it as a sign of aging trend conditions.
Volatility and Range Dynamics
Volatility patterns can provide context for exhaustion. Two broad regimes are relevant.
- Compression before failure. In a mature trend, average true range may contract as price grinds in the trend direction. If that compression produces marginal new extremes without strong follow-through, it can set the stage for a sharp counter-move once volatility re-expands.
- Acceleration and parabolic curvature. Late-stage trends can show rising volatility and steeper price curvature. If increasingly large bars appear near the end of a prolonged move, followed by a sudden inability to continue, the pattern often reflects late participation that is quickly absorbed.
Market Structure Shifts
Market structure provides the scaffolding for reading exhaustion. A healthy uptrend typically prints higher highs and higher lows. Signs of exhaustion often emerge before a structural violation is visible. The following structure features are frequently monitored.
- Failure to make a new higher high or lower low. After a mature uptrend, price may stall below a prior swing high despite multiple attempts. In a downtrend, buyers may prevent a new lower low.
- Lower high or higher low after a climax event. A spike high that is followed by a lower high, or a spike low that is followed by a higher low, indicates that the market could be transitioning away from persistent trend behavior.
- Break of a minor swing level. Exhaustion often precedes a break of a recent minor swing low in an uptrend or a minor swing high in a downtrend. That break marks a structural test rather than a completed reversal.
- Channel slope decay. The slope of a channel or moving average may flatten as the market spends more time retracing than progressing. This time-based deterioration is a subtle form of exhaustion.
Why Traders Pay Attention
Traders study exhaustion signals to manage information about the aging of a trend. Aging trends are more sensitive to shocks, earnings events, macro releases, or liquidity holes. Recognizing fatigue helps frame risk and uncertainty, contextualize news shocks, and calibrate expectations about volatility and follow-through. In portfolio terms, exhaustion analysis informs the probability that a prevailing regime is becoming less reliable. This is an interpretive tool rather than a directive to change positioning.
Practical Chart-Based Context
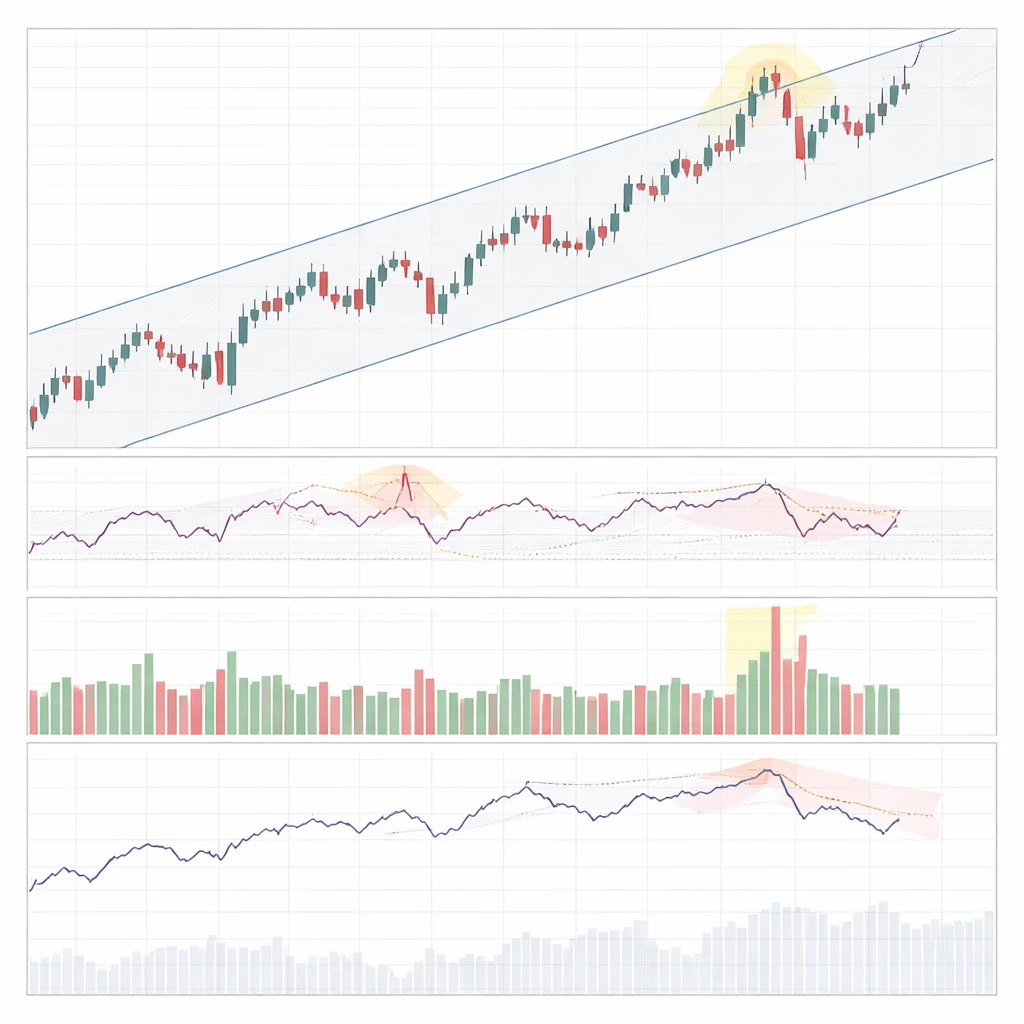
Example 1: Uptrend Exhaustion Near a Channel Throw-over
Consider a stock that has advanced within a rising channel for several weeks. Price accelerates into the upper boundary and briefly pushes above it. The breakout bar shows a long upper wick and closes back inside the channel. Volume spikes to the highest level in a month, but the next session fails to follow through. A momentum oscillator prints a lower high even as price made a marginal new high.
Interpreting this sequence focuses on the confluence of evidence. The throw-over and immediate return signal overextension. The long upper wick shows supply appearing at higher prices. The volume spike without continuation suggests a late burst of participation that did not establish new sponsorship. The momentum non-confirmation indicates deceleration. This combination is consistent with trend exhaustion. Subsequent price action that fails to achieve another higher high and eventually breaks a minor swing low would reinforce the structural shift from persistent advance to a more two-sided market.
Example 2: Downtrend Exhaustion With Capitulation Tone
Imagine a currency pair in a multi-week decline. After a series of lower lows, a wide range down day appears with a long lower shadow. Intraday, price sells off sharply, then rebounds to close near the midrange of the bar. Volume or tick activity is elevated. Over the next two sessions, price attempts to push lower but fails to extend meaningfully. A rate-of-change indicator turns up even though price tests the lows.
This configuration contains several exhaustion elements. The long lower shadow indicates demand responding aggressively to lower prices. The failed range extension on subsequent sessions shows an inability to continue the decline. The rate-of-change uptick is a sign of diminishing downside momentum. Whether the market transitions to a base or simply pauses cannot be known in advance, but the reading of trend fatigue is justified by the observed behavior.
Example 3: Intraday Opening Drive and Exhaustion
On an index future, the session opens with a strong upward drive, producing a large gap and rapid advance in the first 15 minutes. The next 30 minutes show smaller bars, overlapping ranges, and several upper wicks as attempts to push higher attract quick selling. Volume is front-loaded, with a marked tapering after the first half hour. A one-minute momentum study shows lower highs even as price tests the session high.
Here, the opening impulse appears unsustained. The tapering volume and repeated failure to extend suggest that the initial drive exhausted near-term buying power. Intraday context reminds us that exhaustion can be time-scaled. Signals that carry weight on a one-minute chart may resolve over minutes rather than days, yet the reasoning about participation and extension failure remains consistent.
Distinguishing Exhaustion From Consolidation
Not every pause indicates exhaustion. Consolidation can be a healthy midpoint correction in a trend that later resumes. Distinguishing features often relate to asymmetry and follow-through.
- Asymmetry in failed pushes. In an uptrend, repeated failed pushes higher combined with deeper or faster pullbacks indicate a shift in control. Pure consolidation usually shows balanced oscillation without increasing pullback aggression.
- Contextual breadth and volume. A consolidation that occurs alongside stable or improving breadth and moderate volume can be constructive. Exhaustion often occurs with narrowing breadth or a volume surge that fails to carry forward.
- Structural tests. Consolidations typically hold key swing levels and moving average slopes remain supportive. Exhaustion often precedes slope decay and minor swing violations.
False Positives and Limitations
Exhaustion analysis is vulnerable to false signals. Several factors contribute.
- Persistent trends. Some trends persist despite prolonged divergences and repeated failed extensions. Markets can remain strong or weak longer than a single indicator can measure.
- News and regime shifts. A surprise catalyst can negate exhaustion quickly. For instance, a positive earnings surprise can refresh an uptrend that looked tired. This is not a contradiction but evidence that price behavior is conditional on new information.
- Timeframe mismatch. Exhaustion on a short timeframe may be insignificant against the backdrop of a dominant higher timeframe trend. Multi-timeframe context reduces confusion.
- Indicator parameter sensitivity. Divergences and failure swings depend on lookback windows and smoothing choices. Minor variations can change the signal, which calls for caution in treating precise thresholds as universal.
Contextualizing With Multiple Evidence
Experienced chart readers cross-check exhaustion clues across price, volume, momentum, breadth, and volatility. The aim is not to add indicators indiscriminately. It is to link complementary evidence. A practical workflow might involve: observe price extension relative to a channel or prior swing, evaluate whether momentum and volume confirm the extension, assess breadth for indices, and note volatility behavior. Confluence increases confidence in the interpretive reading without implying certainty.
Microstructure Clues and Liquidity Considerations
On short horizons, exhaustion can reflect liquidity dynamics. Stop runs may produce a final push beyond an obvious level, capture resting orders, and then lose follow-through as liquidity fades. Long wicks that pierce prior highs or lows and then close back inside the range are one visual representation. Volume clusters that appear at the edge of the range, followed by inactivity, also fit the exhaustion theme. These are descriptive observations of how order flow sometimes concentrates at key points.
Measuring and Documenting Exhaustion for Study
For systematic learners, documenting exhaustion can improve consistency. A structured log might include:
- Price features such as throw-over, gap fill, long wick, or range extension failure.
- Momentum state such as divergence, failure swing, or oscillator slope change.
- Volume state such as drying participation on extensions or volume climax without follow-through.
- Volatility state such as compression or late-stage acceleration followed by stalling.
- Structure tests such as inability to make a new higher high or lower low, or a minor swing break.
After labeling events, reviewing outcomes over a large sample helps calibrate expectations about how often exhaustion leads to sideways drift, modest pullbacks, or larger structural changes. This is not prediction. It is an exercise in understanding conditional tendencies and the variability of market responses.
Time and the Aging of Trends
Trends have a temporal dimension. Even without dramatic price or volume anomalies, a trend can tire as time passes and the balance of informed participants adjusts. Extended duration without meaningful corrections can create sensitivity to modest shocks. The absence of new information that supports the trend can produce gradual slope decay. Recognizing that time itself can be a factor avoids overreliance on single-bar or single-day patterns.
Applications Across Asset Classes
Exhaustion signals appear in equities, fixed income, currencies, and commodities, but context matters. Commodity trends often end with clear volume or volatility climaxes as inventories, hedging activity, and seasonality interact. Currency trends can show long periods of drift and then abrupt exhaustion when macro policy expectations change. Equity indices may display breadth divergence before price reacts. The mechanisms differ, but the common theme is waning ability to extend in the trend direction.
Putting It Together Without Overfitting
Reading exhaustion is a synthesis task. Overfitting occurs when one demands perfect alignment of indicators before acknowledging fatigue, or when one treats a single sign as decisive. A balanced approach accepts ambiguity. It weighs multiple dimensions while recognizing that markets can refresh trends after short pauses. The analytical goal is to assign a reasonable description of trend health and to watch how structure evolves afterward.
Extended Illustrative Walkthrough
To connect the concepts, consider a hypothetical equity index during a multi-month advance.
Phase 1 shows broad participation. The advance-decline line rises with price. Rallies occur on expanding volume and pullbacks are shallow. Momentum highs confirm price highs. Trend structure is strong.
Phase 2 shows early signs of fatigue. The index makes new highs, but breadth softens. Momentum peaks slightly below its prior peak while price marginally exceeds the old high. Range per session decreases as the market grinds upward. Volume on up days fades compared with the advance’s early weeks.
Phase 3 displays visible exhaustion. Price throws over the upper channel and closes back inside. A gap up is filled quickly the next day. A wide range up day appears without follow-through. A cluster of small real bodies forms near the highs, punctuated by long upper shadows on intraday attempts higher.
Phase 4 brings structural tests. After the throw-over, price fails to set a new higher high. A minor swing low is broken on a pickup in volatility. Breadth remains weak and sector leadership narrows. At this point, the description of exhaustion is grounded in price, momentum, volume, breadth, and volatility together. Whether the market forms a range, rotates, or reverses will depend on subsequent information, but the prior uptrend’s reliability has clearly deteriorated.
Cautionary Notes for Interpretation
Three cautions help maintain discipline when interpreting exhaustion.
- Context dependence. A volume spike during earnings season has a different meaning than a spike during a quiet period. A wick on thin overnight trading may not carry the same weight as one during active hours.
- Sample size and recency bias. An analyst may overemphasize the last dramatic exhaustion episode. Balanced interpretation relies on broad sampling and consistent criteria.
- Complementarity, not redundancy. Choose tools that add distinct information. Price structure, momentum, volume, breadth, and volatility each address different aspects of trend health.
Why the Concept Matters for Market Education
Studying exhaustion strengthens literacy in market structure. It encourages thinking in terms of conditions and transitions rather than binary predictions. It also trains attention on the relationship between participation and price movement. By focusing on how and why a trend accomplishes new extremes, analysts learn to evaluate the quality of a trend, not just its direction.
Key Takeaways
- Trend exhaustion signals indicate weakening conditions behind a move, not a guaranteed reversal.
- Price action clues include long wicks, throw-overs, exhaustion gaps, shrinking range efficiency, and extension failures.
- Non-confirmation across momentum, volume, breadth, and volatility strengthens the interpretation of fatigue.
- Market structure often shifts after exhaustion, with failure to make new extremes and minor swing violations.
- Context and confluence matter. Signals are probabilistic and benefit from multi-timeframe and cross-dimensional assessment.