Trends & Market Structure

Identifying trends, ranges, breakouts, and overall market structure.

Part of Technical Analysis

What you will learn

This scope is designed to help you build a practical understanding of Trends & Market Structure. Lessons move from core definitions to real-world context and common failure points.

Lessons

Reading in order is recommended, but each lesson stands on its own.

12 min read
Beginner

What Is a Market Trend?

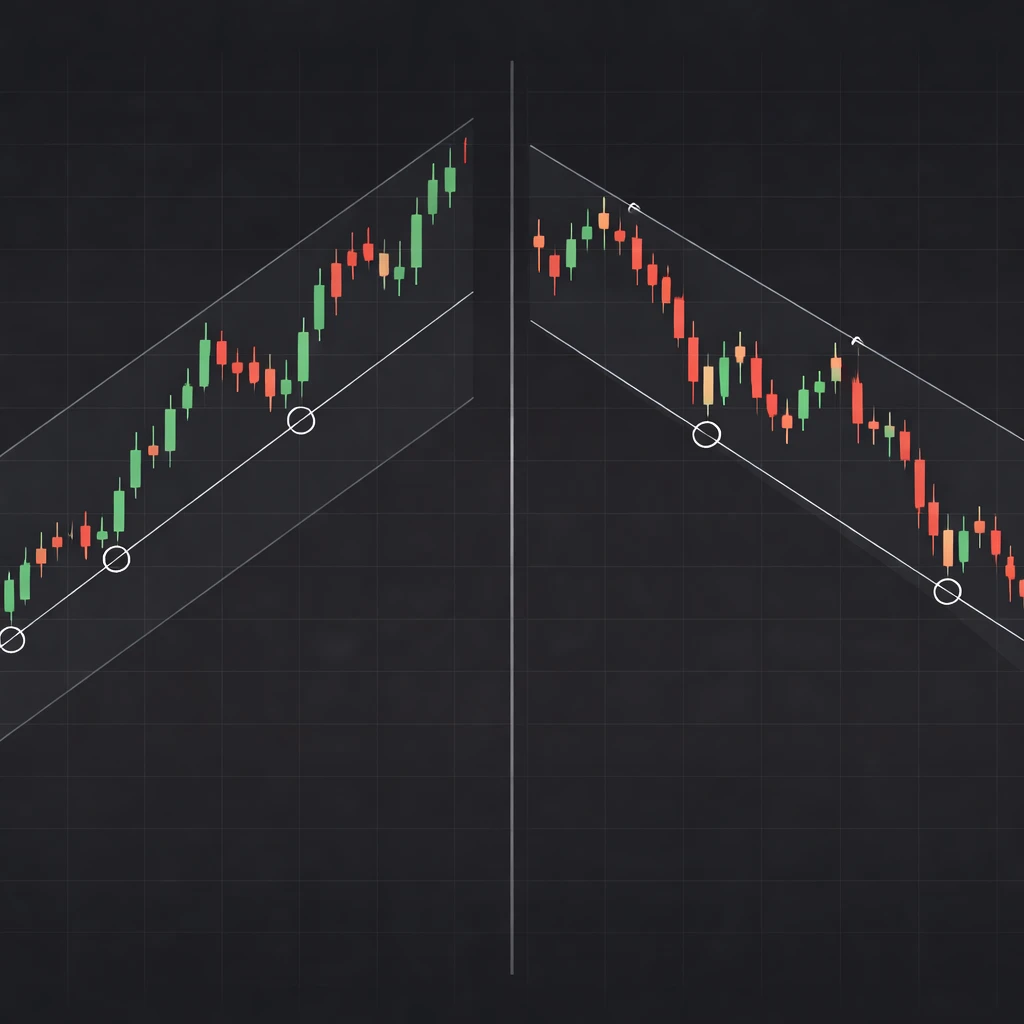
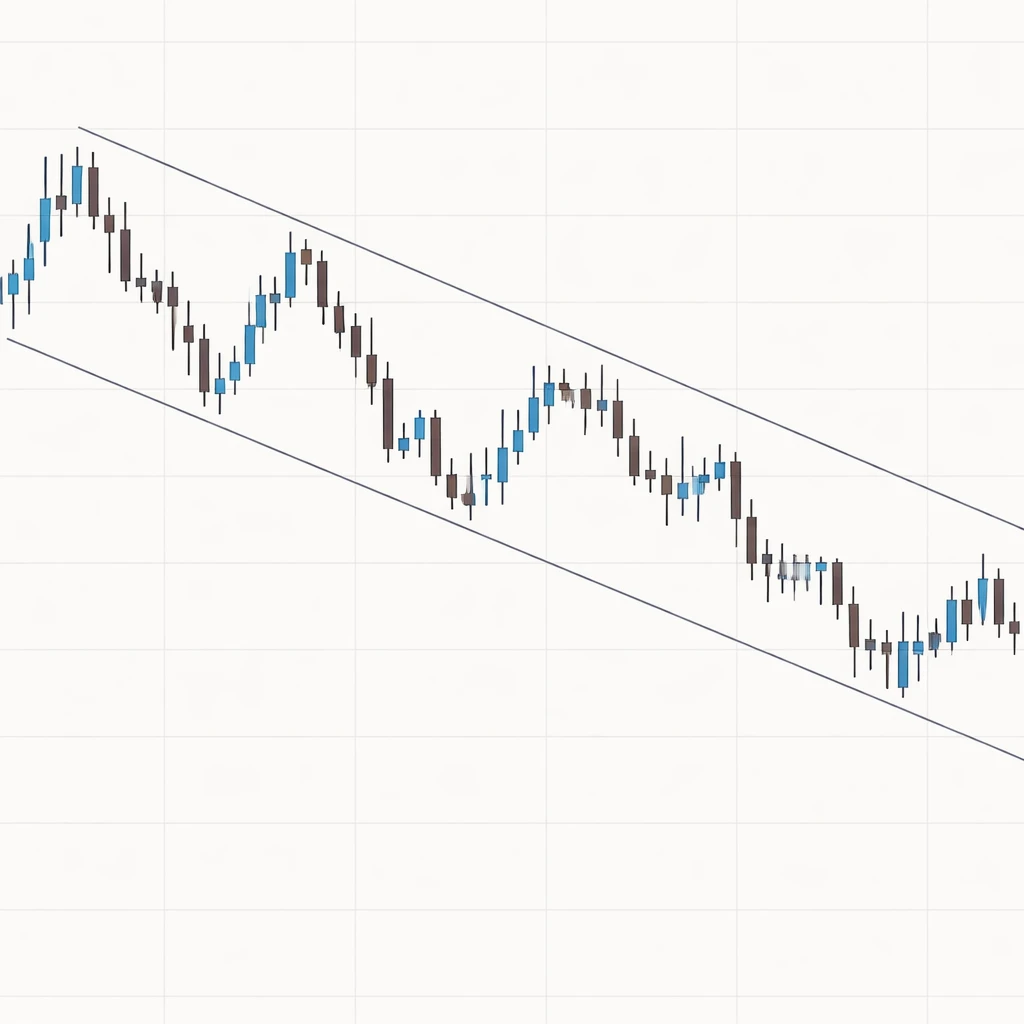
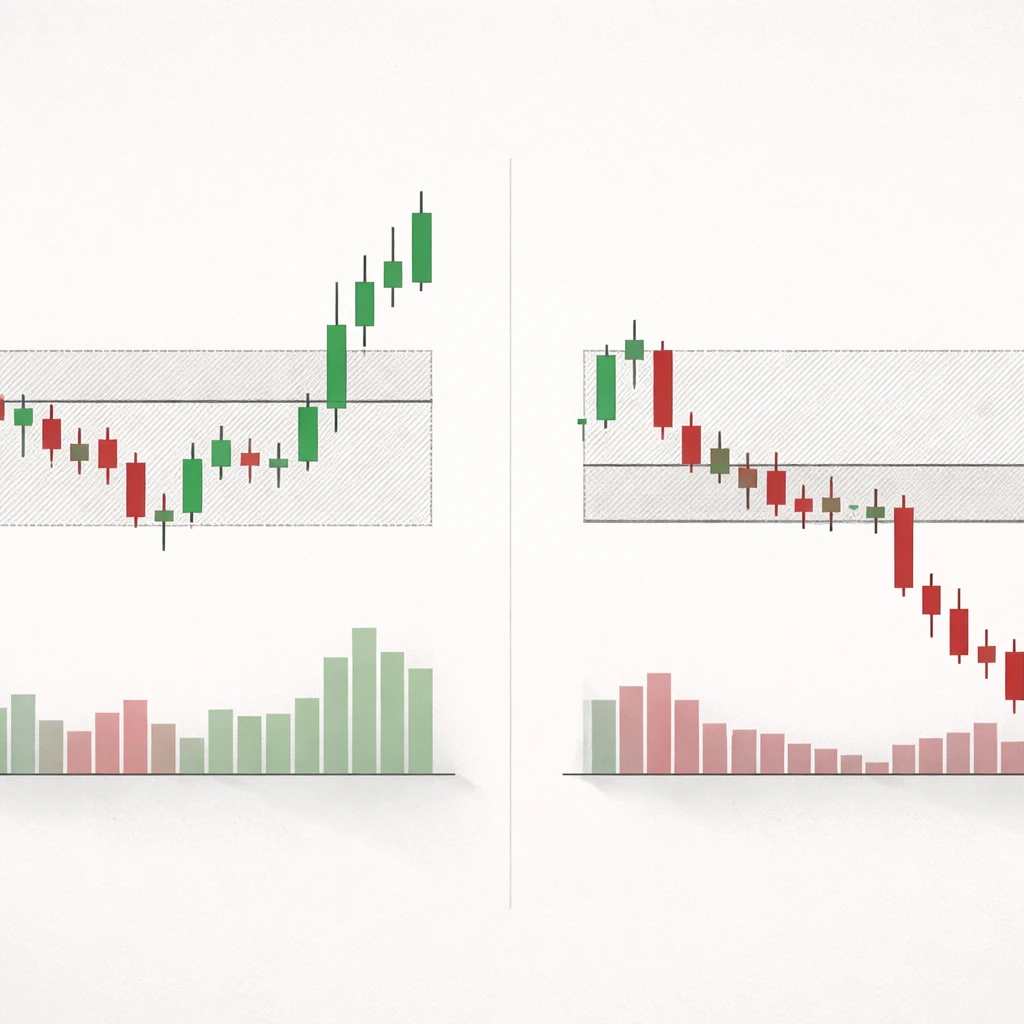
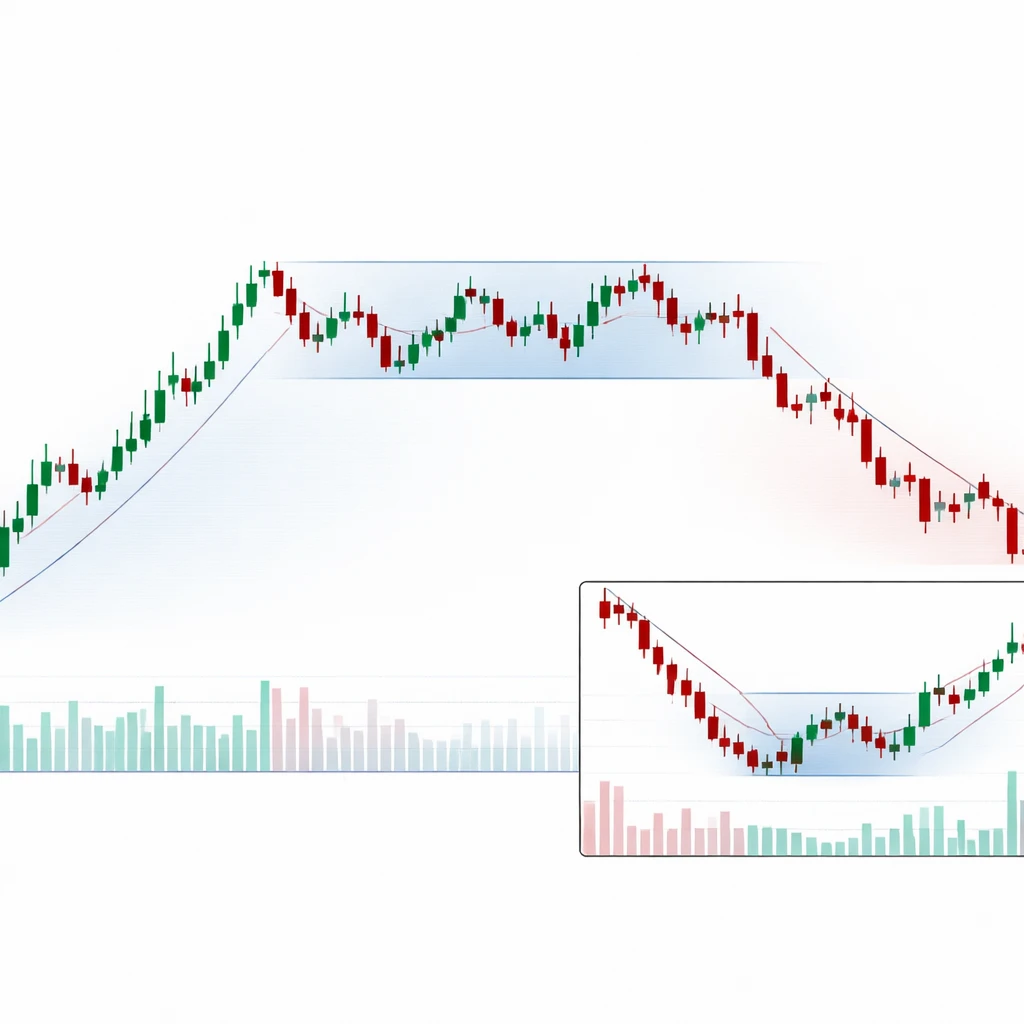
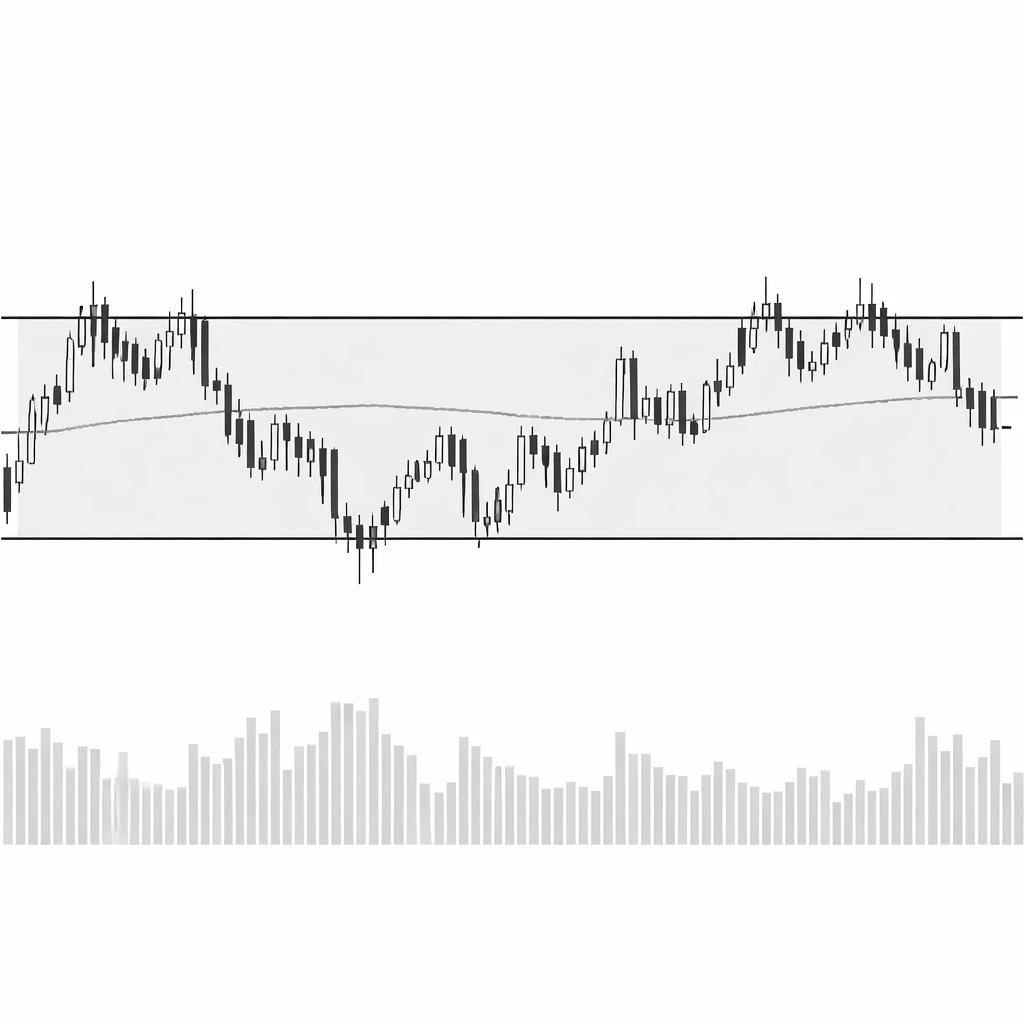
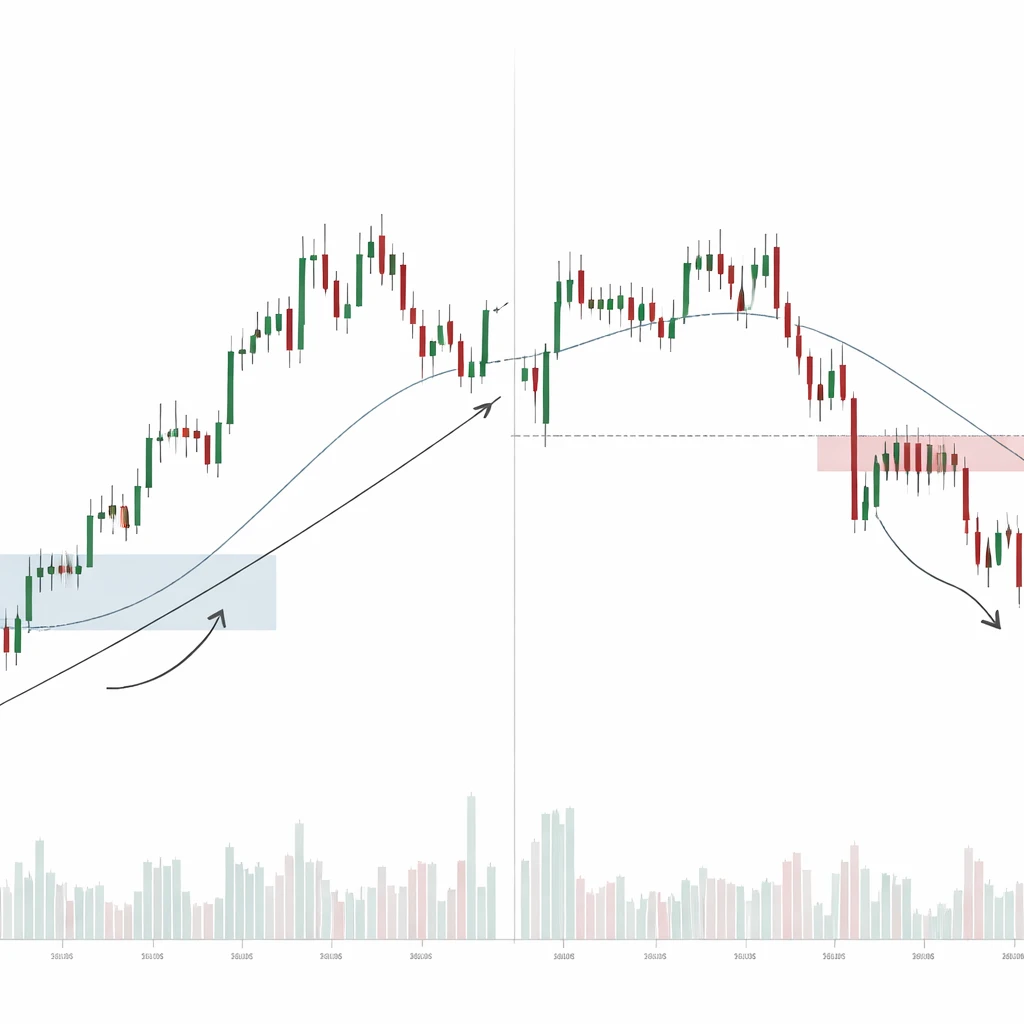
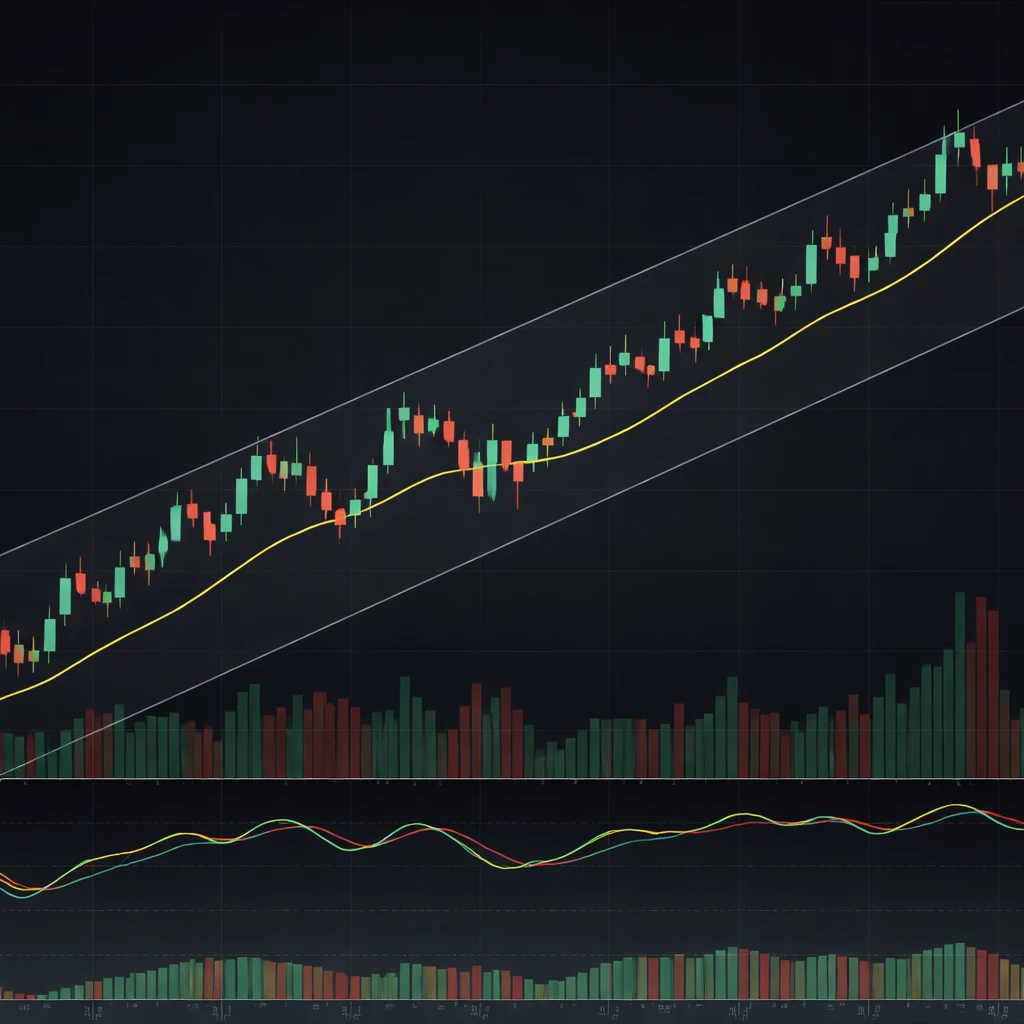
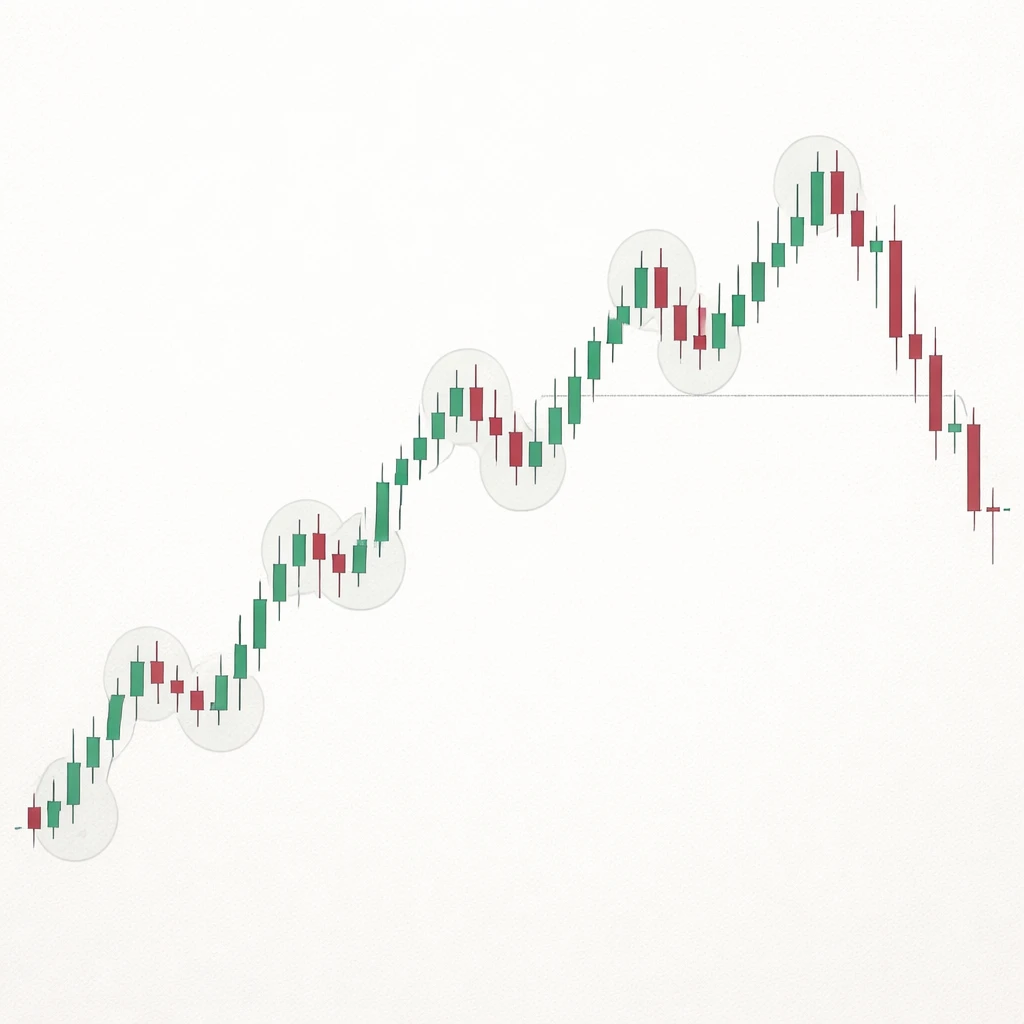
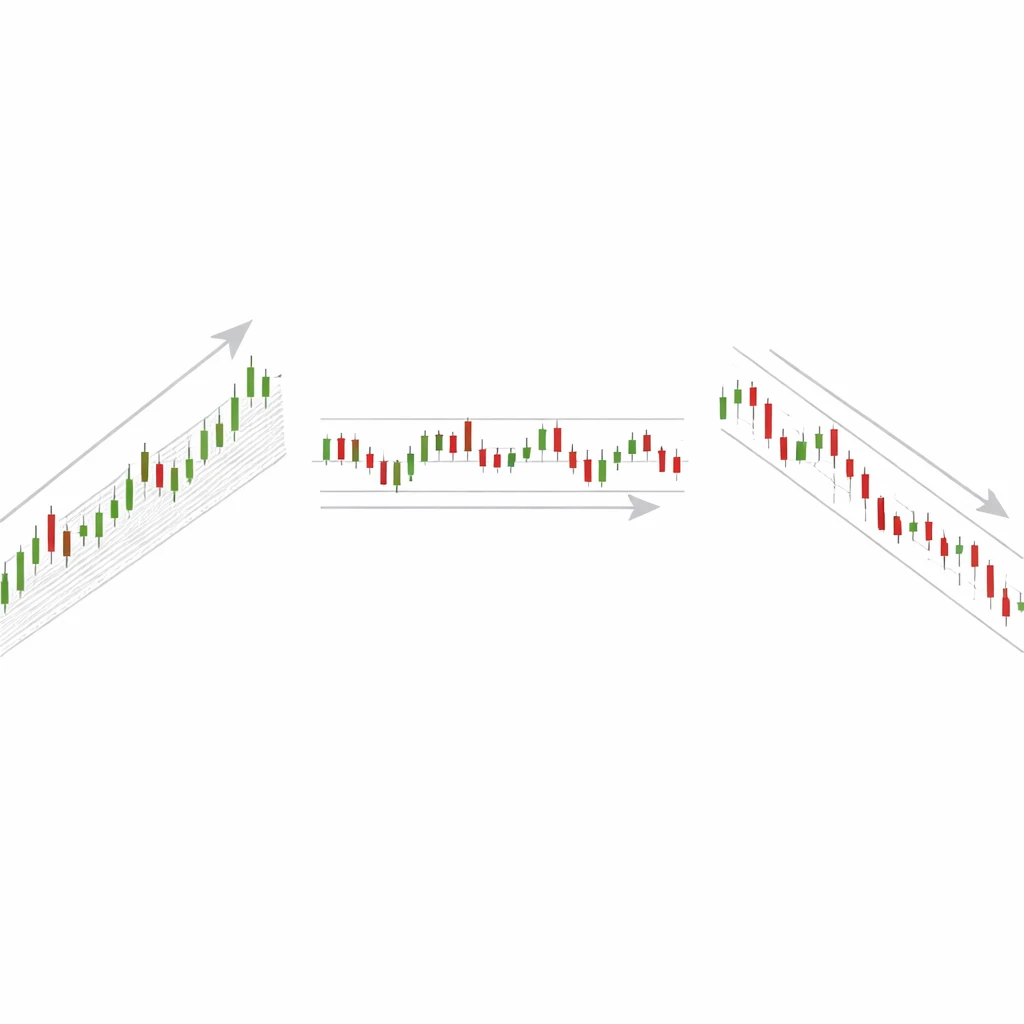
A market trend is the directional tendency of price over a defined timeframe, observed through sequences of swing highs and lows. This article explains how trends appear on charts, how they relate to market structure, why they matter for interpretation, and how to study them without relying on trading signals.

10 min read
Beginner

Uptrends vs Downtrends

A clear explanation of how uptrends and downtrends are defined, how they appear on charts, and why the structure of higher highs and higher lows or lower highs and lower lows matters for interpreting market behavior. Includes practical chart-based context without trading strategies or recommendations.

10 min read
Beginner

Lower Highs and Lower Lows

An in-depth explanation of lower highs and lower lows, how they appear on price charts, why they matter for reading market structure, and how to interpret them within practical chart contexts without implying specific trades or recommendations.','content':'Lower highs and lower lows describe a recurring price sequence associated with downward marke…

9 min read
Beginner

Higher Highs and Higher Lows

An in-depth explanation of higher highs and higher lows as a structural building block of uptrends, including how to recognize the pattern on charts, why it matters for interpreting price behavior, and how to contextualize it across timeframes without implying trading decisions.

12 min read
Intermediate

Breakouts vs Breakdowns

Breakouts and breakdowns mark price moving beyond well-defined boundaries of market structure. This article explains how they form on charts, what information they convey about supply and demand, and why analysts monitor them when interpreting trend and regime changes.

12 min read
Intermediate

Trend Transitions Explained

An in-depth explanation of how market trends transition from expansion to balance and from one direction to another, what those transitions look like on charts, and why they matter for interpreting price behavior and market structure, without strategies or recommendations.

11 min read
Intermediate

Ranging Markets Explained

A clear, academically grounded explanation of ranging markets in technical analysis, including how ranges appear on charts, what they reveal about supply and demand balance, and how to interpret their structure without resorting to trading strategies or recommendations.

10 min read
Intermediate

Pullbacks vs Reversals

An in-depth explanation of pullbacks and reversals in technical analysis, how they appear on charts, the market structure behind them, and why the distinction matters for interpreting price behavior across timeframes and assets. Includes practical chart-based context without strategies or recommendations.

10 min read
Intermediate

Trend Strength and Duration

A clear explanation of how trend strength and duration describe the pace and persistence of directional price movement, how these qualities appear on charts, and why they matter for interpreting market structure and behavior. Includes practical chart-based examples and guidance on reading swings, slope, and time without offering trade setups.

10 min read
Intermediate

Market Structure Shifts

An in-depth explanation of market structure shifts, how they appear on price charts, why analysts track them, and how to interpret their significance within broader trend and range contexts. The article focuses on definition, identification, and practical chart-based context without providing strategies or recommendations.