Lower highs and lower lows describe a recurring price sequence associated with downward market structure. The concept sits at the core of classical technical analysis because it organizes raw price movement into a logical narrative. When a market repeatedly fails to reclaim prior peaks and then falls to fresh troughs, the sequence signals that selling pressure is persistent and that buyers have been unable to regain control of the trend.
Understanding this pattern helps interpret price behavior without relying on forecasts. It frames how price swings relate to one another across timeframes, clarifies whether pullbacks are likely to be countertrend, and highlights what would need to change for a downtrend to lose structure. The sections that follow define the terms precisely, show how the sequence appears on charts, and discuss why many market observers pay close attention to it.
Core Definitions
Swing high and swing low
A swing high is a local price peak that stands above the prices immediately on either side of it. In simple terms, price rallies into a level, hesitates or reverses, and then trades lower, leaving a visible crest on the chart. A swing low is the mirror image: a local trough with price dipping down, stabilizing, and then moving back up.
Many chart readers apply a practical rule to identify a swing: a swing high forms when a bar or candle has a high that is higher than the highs of the bars directly before and after it. A swing low forms when a bar has a low that is lower than the lows of the bars directly before and after it. Some prefer using more than one bar on each side to filter noise. The exact definition varies by methodology, yet the intuition is consistent. The chart must visibly pivot.
Lower high
A lower high occurs when the most recent swing high is below the previous swing high. This indicates that buying strength was insufficient to lift price back to the earlier peak. Each lower high is a record of where sellers reasserted pressure sooner than they did earlier in the sequence.
Lower low
A lower low occurs when the most recent swing low is below the previous swing low. This shows that sellers pushed price to a new trough beyond the prior floor, reflecting an extension of the downside impulse.
Putting the Sequence Together
In a mature downtrend, lower highs and lower lows appear in alternation. Price falls to a new low, then rebounds to a lower high, then turns down and falls to a new low again. The alternation is not mechanically perfect. Markets can pause or create complex consolidations, yet the broad staircase still slopes downward.
The sequence conveys two messages. First, each lower high reveals a market that is selling off sooner than before, showing that supply is aggressive or that demand is retreating. Second, each lower low confirms that downside momentum is carrying through, not merely stalling at previous troughs. Observers generally need both elements to argue that the trend is structurally down, especially when filtering out minor fluctuations.
How It Appears on Charts
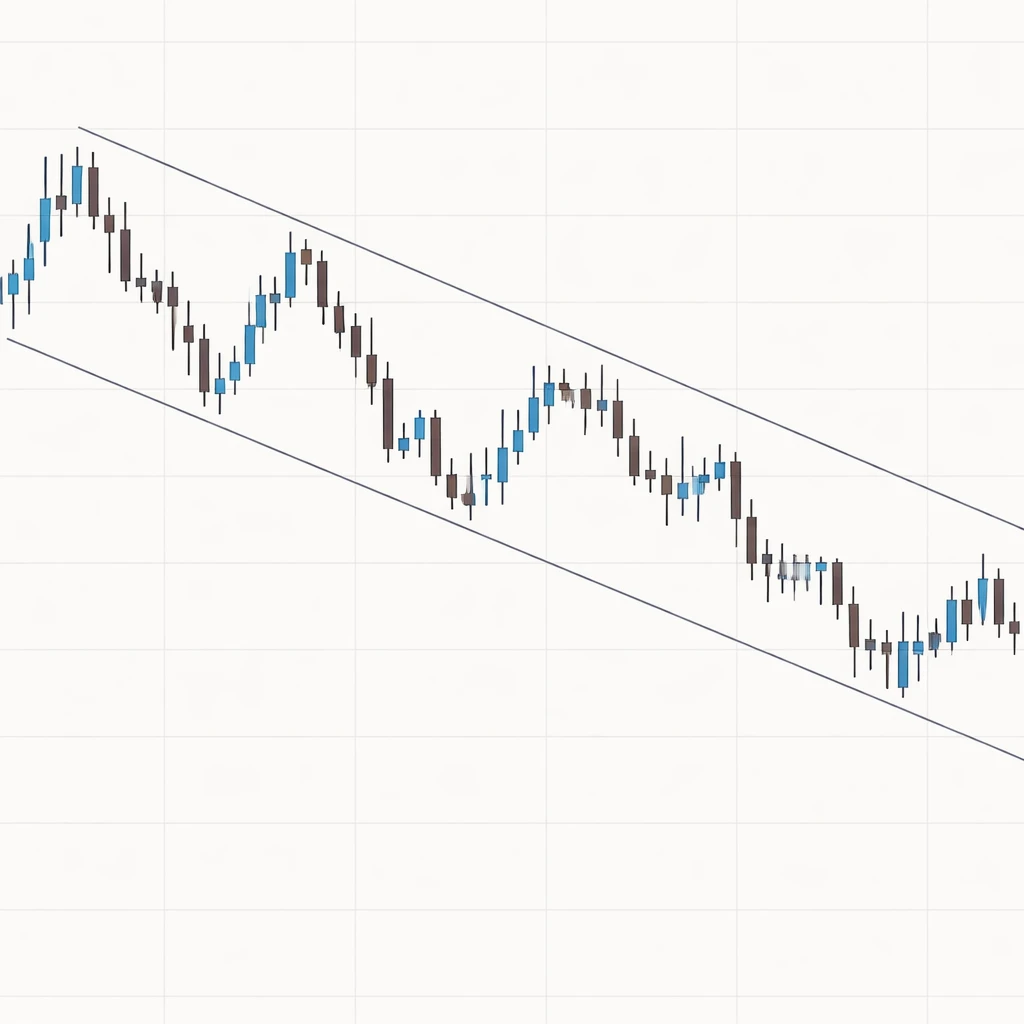
On a candlestick or bar chart, lower highs and lower lows often look like descending waves. Peaks form a downward-sloping chain, and troughs mark progressively lower levels. A trader may draw a line across the swing highs to visualize resistance that drifts downward over time. A second line across the swing lows can frame a descending channel. The space between the lines helps depict the typical amplitude of rallies and declines during the trend.
The pattern can be clean or messy depending on volatility. In quiet downtrends, price often respects a fairly consistent channel, stair-stepping lower with pullbacks that retrace a moderate portion of the prior decline. In more volatile conditions, pullbacks can be sharp, sometimes exceeding the prior swing high intraday, before closing back below it and preserving the structure. Chart readers therefore evaluate swings with attention to closing prices, intraday spikes, and the timeframe under review.
Timeframe matters. On a weekly chart, a market might show an orderly sequence of lower highs and lower lows across months. On a 15-minute chart of the same instrument, dozens of small oscillations can occur within what appears to be a single weekly swing. The structure is fractal. The definition of lower high relative to lower high always depends on the scale chosen.
Why It Matters for Interpreting Price Behavior
The primary reason market participants watch for lower highs and lower lows is informational. The sequence demonstrates how buyers and sellers are interacting over time. Several interpretive points commonly arise:
- Dominant direction: A consistent sequence indicates that the path of least resistance has been down. Pullbacks that stop below prior highs are countertrend rallies within a broader decline.
- Character of supply and demand: Lower highs imply that sellers are willing to act at progressively lower prices or that buyers are less willing to bid the market back to former peaks. Lower lows show that downside pressure is strong enough to break past prior support.
- Context for pullbacks and impulses: The rallies between lower lows can be viewed as retracements. The declines to fresh lows are the impulses that sustain the downtrend.
- Potential for structural change: If the market eventually rallies above the most recent lower high and then forms a higher low, the downtrend structure has weakened or ended. Observers often mark the most recent lower high as a reference point for such a change.
- Communication across timeframes: A daily series of lower highs and lower lows can contain multiple intraday upswings that never violate the daily structure. Identifying the correct frame avoids confusion.
Establishing Swings with Practical Rules
Because price fluctuates continuously, identifying which turns count as meaningful swings requires a consistent approach. Several pragmatic conventions appear in technical work:
- Local pivot confirmation: Count a swing high only after a subsequent bar closes lower than the bar with the candidate high. Count a swing low only after a subsequent bar closes higher than the bar with the candidate low.
- Minimum distance criteria: Some analysts require that a swing exceed a threshold in points or percentage terms to filter noise. This prevents labeling tiny fluctuations as full swings.
- Time separation: Others demand a minimum number of bars between swings so that the chart does not alternate highs and lows too rapidly.
These conventions do not change the concept. They provide a consistent lens so that lower highs and lower lows reflect true structure rather than incidental wiggles.
Illustrative Chart-Based Example
Consider a daily chart of a stock that recently peaked at 100. Price sells off to 94, bounces to 97, falls to 92, rallies to 96, then slides to 89. Labeling swings with a simple rule that requires a clear pivot, the sequence might read:
- Swing high: 100
- Swing low: 94
- Lower high: 97
- Lower low: 92
- Lower high: 96
- Lower low: 89
This staircase marks both lower highs and lower lows. The stock failed to revisit 100 on the bounce to 97, then failed again to surpass 97 on the bounce to 96. Meanwhile, each decline undercut the prior trough. If the next rebound reaches only 95 and then price falls to 87, the structure remains intact. If price instead rallies above 96, that event cancels the most recent lower high, though the longer sequence still depends on subsequent swings. A true shift in structure would require a rally above the most recent lower high and then the formation of a higher low that holds above a prior trough.
The same logic applies to intraday charts. Suppose a futures contract has a sequence of 4300 to 4268 to 4286 to 4254 to 4278 to 4239 on a 30-minute chart. That path shows two lower highs at 4286 and 4278 and two lower lows at 4254 and 4239. Traders who track such sequences are not necessarily estimating what comes next. They are documenting what has already occurred and noting the conditions that would need to change for the structure to be considered broken.
Reading Pullbacks within the Sequence
Pullbacks inside a downtrend can vary in speed, depth, and duration. Some are shallow and short-lived. Others retrace a large portion of the prior decline. Chart readers evaluate pullbacks to decide whether they look corrective or whether they hint at a potential structural change.
Several signals are common in descriptive analysis:
- Depth relative to the last downswing: A pullback that retraces only a modest fraction of the previous decline tends to preserve rhythm. A deeper retracement approaches or challenges the prior swing high.
- Time spent rallying versus declining: If rallies take longer than declines and carry to successively higher levels, the downtrend may be losing control.
- Price acceptance at lower highs: Extended consolidation under the prior swing high often indicates agreement with lower pricing. Repeated probes without acceptance can signal hesitation.
These are descriptive tools. They offer a structured way to read the tape rather than a prescription for action.
Gaps, Spikes, and Equal Lows
Market structure is rarely perfectly textbook. Several complications are frequent:
- Gaps: Overnight or news-driven gaps can create a new lower low that appears far from the prior close. Some analysts anchor swings to intraday extremes, while others focus on closing levels to avoid reacting to temporary outliers.
- Spikes and tails: A long lower shadow on a candle may push to a marginal new low and reverse within the same period. Whether that counts as a decisive lower low depends on the method in use.
- Equal or near-equal lows: Sometimes a market tests a prior trough and bounces a few ticks above it. The question of whether a lower low has occurred is then a matter of tolerance and definition. Many treat a near-equal low as a retest rather than a break.
The same issues occur with highs. A marginal new high that immediately fails may or may not negate a sequence of lower highs, depending on the chosen rules.
Channels, Trendlines, and Structure
Connecting lower highs with a trendline provides a clear visual of resistance that descends over time. Drawing a parallel line across lower lows often produces a downward channel. These tools are not precise predictors. They act as reference frames. When price rides the lower boundary of a channel, the downtrend is pressing. When price oscillates between boundaries, the rhythm is more balanced. If price pushes beyond the upper boundary, the downtrend may be stretching or losing shape, and analysts will watch for whether structure actually changes through higher highs and higher lows later on.
Channels help set expectations for variability. In many declines, price does not fall in a straight line. It pulses. The bounded space gives a visual estimate of that pulsing behavior.
Multiple Timeframe Context
A useful way to avoid confusion is to assign a primary timeframe for structure and a secondary timeframe for detail. The weekly chart might show a clear series of lower highs and lower lows spanning a quarter. The daily chart may contain several week-long countertrend rallies within the same decline. The intraday chart may display even smaller countertrend sequences within those rallies.
Structure can conflict across frames. It is common to see a market in a weekly downtrend while the daily chart temporarily makes a higher high during a strong rally. Whether the higher high on the daily chart implies a durable shift depends on subsequent swings. The weekly structure may not change unless the rally removes the last weekly lower high and then holds a higher low on that frame.
Common Pitfalls in Identifying Lower Highs and Lower Lows
Errors in reading structure often come from inconsistent rules or from overreacting to noise. Several pitfalls occur frequently:
- Counting every minor fluctuation: Overly sensitive definitions label insignificant blips as swings, creating a false impression that structure has reversed.
- Switching definitions midstream: Changing the rule for what constitutes a swing after seeing the result leads to inconsistent labeling and selection bias.
- Ignoring the closing context: Intraday spikes can break a level briefly. Many analysts prioritize where the market closes on the relevant timeframe.
- Forgetting the influence of volatility: In high-volatility conditions, swings expand and boundaries widen. What looks like a structural break at low volatility can be routine noise at high volatility.
- Timeframe confusion: A structural break on a 5-minute chart does not automatically overturn a weekly downtrend. Each frame must be judged on its own terms.
Complementary Observations Without Prescribing Strategy
Lower highs and lower lows are a price-only concept. Many analysts still cross-check the structure with other observational tools to enrich interpretation, without relying on any single input.
- Volume: Expanding volume into declines can be read as confirmation that supply is active. Diminishing volume on rallies may fit the idea of countertrend demand. Volume behavior, however, varies by instrument and seasonality.
- Volatility measures: An elevated Average True Range or wider daily ranges often accompany mature downtrends. Rising volatility can make swings appear less orderly and increase the need for wider filters.
- Moving averages: A downward-sloping long-term average is consistent with a sequence of lower highs and lower lows. Prices rallying into a falling average frequently align with lower-high development. The average itself is not structure, but it can provide context.
- Market regime and catalysts: Macro events, earnings releases, and policy decisions can punctuate a downtrend with gaps or swift reversals. Price structure records the outcome of these catalysts but does not anticipate them.
Quantitative Perspective on Structure
Some practitioners convert the qualitative idea of lower highs and lower lows into rules for detection. For instance, they may program a swing definition that requires a minimum percentage move to tag a new high or low. Others compute the distribution of swing sizes in a given market to define what is typical noise versus a meaningful swing. These quantitative approaches aim for consistency rather than superior prediction.
Another quantitative angle involves scaling. On logarithmic charts, equal percentage moves occupy equal vertical distance, while on linear charts equal point moves do. In instruments where price varies across a large range, using log scale can change the visual impression of whether a high is meaningfully lower or a low is meaningfully lower, although the raw definition remains the same.
When the Sequence Changes
The downtrend logic built on lower highs and lower lows persists until it does not. A structural change usually requires two steps. First, price must exceed the most recent lower high, which stops the pattern of declining peaks. Second, a subsequent pullback must hold above a prior low and produce a higher low. Only after both conditions are in place does the market show an initial higher-high/higher-low sequence that signals a different structure has emerged on that timeframe.
Single events rarely suffice. A dramatic one-day rally can remove a recent lower high but then fail and fold back into the downtrend. Likewise, a marginal violation of a prior high that quickly reverses may say more about volatility than about structure. Observers often wait for a clear higher low to confirm that the rhythm has truly changed.
Interpreting Consolidations Inside a Downtrend
Downtrends are often punctuated by pauses where neither side has clear control. These ranges can compress between two nearby levels or unfold as triangles and other converging formations. In these periods, lower highs may persist even if lower lows do not, or vice versa. The incomplete sequence is a sign of indecision rather than reversal. A subsequent break that resolves the range will reestablish either the downtrend or a new structure depending on which side is taken out and followed by confirmation.
Historical Context and Behavioral Interpretation
The idea of lower highs and lower lows is older than modern computing. It reflects the basic auction dynamic that underpins price discovery. Sellers probe how low they must go to find buyers. Buyers test how high they can push before meeting resistance. In a decline, rally attempts draw in sellers earlier than before, and selloffs find buyers only at lower prices. This process can be slow, steady, or violent, but the signature of the decline remains the same until the pattern is broken.
Behavioral tendencies contribute to the pattern. Anchoring to prior highs may lead market participants to lighten positions as price approaches those reference points. Loss aversion can accelerate declines when prior lows break. None of these tendencies guarantee outcomes; they help frame why the pattern is common across different assets and time periods.
Practical Chart Review Process
A structured review often includes the following steps, adapted to the chosen timeframe and rules:
- Mark recent swing highs and swing lows using a consistent definition.
- Check whether the latest swing high is below the previous swing high and whether the latest swing low is below the previous swing low.
- Draw reference lines through the chain of lower highs and lower lows to visualize the channel, noting the slope and variability.
- Observe whether pullbacks are gaining or losing depth and whether declines are accelerating or stalling.
- Identify the most recent lower high as a reference for what would have to change to weaken the downtrend structure.
This process yields a transparent, replicable interpretation of the chart. It does not prescribe trades. It documents the current state of market structure and the conditions that would represent a change.
Limits of the Concept
No single concept can fully capture market complexity. A market can display a clear series of lower highs and lower lows and still stage temporary rallies or sideways phases that test patience. In thinly traded instruments, a few prints can alter the sequence without reflecting broad participation. Major news can shift pricing in a way that temporarily breaks structure only to see it resume later. The concept is most informative when combined with other contextual observations and with respect for the chosen timeframe.
Key Takeaways
- Lower highs and lower lows define a downtrend by showing where rallies fail earlier and declines extend to fresh troughs.
- Identifying swings requires consistent rules that filter noise and keep the focus on meaningful pivots.
- The sequence is fractal across timeframes; a downtrend on one frame can contain countertrend moves on a lower frame without breaking structure.
- Structural change typically requires price to exceed the latest lower high and then form a higher low that holds.
- The concept describes market behavior rather than predicting it and is best interpreted alongside context such as volatility, volume, and time horizon.