Support and resistance are among the most widely cited concepts in technical analysis. They refer to price regions where advances or declines tend to slow, pause, or reverse. The language of a “floor” beneath price and a “ceiling” above price is familiar, but the mechanisms are richer than a simple metaphor. These levels form through an interaction of order flow, market microstructure, crowd behavior, and institutional constraints. Understanding why these areas appear, persist, and sometimes fail helps frame price behavior without prescribing trades or predicting outcomes.
Defining Support and Resistance
Support is a price region where downward movement has historically encountered buying interest sufficient to absorb selling pressure. Resistance is a region where upward movement has historically encountered selling interest sufficient to absorb buying pressure. Despite the common use of single horizontal lines, support and resistance are better thought of as zones. Price often oscillates within a band where transient imbalances are absorbed before a new directional move occurs.
These zones arise because markets are continuous processes of matching buyers and sellers. When significant resting orders cluster at similar prices, or when many participants agree that a price region is meaningful, the market tends to respond more slowly and cautiously there. The response may be a short pause, a consolidation, or a reversal, depending on the depth of liquidity and the strength of incoming order flow.
Market Microstructure: Liquidity, Order Flow, and Memory
At the most granular level, prices move because market orders consume available liquidity in the order book. When limit orders cluster at particular prices, the market must trade a larger volume to pass through those layers. Several microstructure features contribute to the formation of support and resistance:
- Resting liquidity. Large buy or sell limit orders accumulate around reference points such as prior highs and lows, session opens and closes, and round numbers. These queues absorb pressure and slow movement.
- Hidden and iceberg orders. Some participants provide liquidity discreetly. Even when visible depth appears thin, replenishment at key prices can repeatedly absorb market orders, creating the impression of a “stubborn” level.
- Stop and take-profit clusters. Stop orders often gather near obvious technical levels. When triggered, they temporarily increase market order flow. The market may pause before the level as resting liquidity absorbs the first wave, or overshoot the level if stops cascade.
- Spread and micro-volatility. As price approaches a widely watched level, market makers may adjust quotes, widening spreads or reducing displayed size. This can create choppy micro-movements around the level and increase the frequency of brief probes.
- Order book memory. Unfilled or partially filled orders can be re-posted after a level is tested. Market participants remember recent difficulty moving through a price region and often reestablish orders there, reinforcing the zone.
From this perspective, support and resistance represent liquidity structures shaped by the history of trading at those prices. If a region has absorbed large flows before, many participants expect it may do so again, which encourages them to provide or withhold liquidity accordingly.
Behavioral Anchors and Crowd Psychology
Behavioral finance provides a second layer of explanation. Prices do not float in a vacuum. Participants carry reference points, emotions, and narratives that influence where they are willing to transact:
- Anchoring. Prior highs, lows, and round numbers become salient references. Investors often evaluate new information relative to those anchors, which can slow adjustment at the boundary.
- Loss aversion and the disposition effect. Holders who bought near a prior peak may seek to “get out at break-even” if price rallies back to that zone. Their sell orders add to resistance. Conversely, traders who missed a prior low may look to buy if price revisits it, reinforcing support.
- Herding and social proof. Widely discussed levels attract attention. As more participants watch the same zone, more orders cluster, making the level consequential regardless of its initial cause.
- Regret and path dependence. Price history shapes expectations. If a region previously contained notable volatility or a sharp reversal, participants may attribute significance to it, altering how they behave when price returns.
These behavioral forces help explain why local extremes and simple round numbers matter on charts. They are not mystical. They are points where human reference frames converge.
Information Flow and Price Discovery
Markets incorporate information gradually. Even when news is public, beliefs differ about its implications, and capital moves at different speeds. Support and resistance often emerge where new information meets entrenched expectations:
- Gradual assimilation. After earnings announcements or macro releases, price may approach a prior reference level and stall while participants reassess fair value.
- Heterogeneous beliefs. When opinions diverge, order flow becomes two-sided near salient levels. This creates congestion zones that appear as ranges on charts.
- Threshold effects. Some models or mandates only update positions when price crosses certain levels. The fixed thresholds create stepwise flows that cluster around known boundaries.
In this way, support and resistance can reflect a negotiation process between competing interpretations of value.
Institutional Practices and Structural Effects
Institutional constraints can reinforce specific price regions:
- Benchmarking and risk controls. Rebalancing near month-end or quarter-end, adherence to tracking error budgets, and internal risk limits can concentrate flows around prior highs, lows, or reference closes.
- Execution protocols. Use of VWAP or TWAP schedules, participation caps, and liquidity-seeking algorithms can distribute orders around visible levels, especially if a benchmark price is within reach.
- Options positioning. Option strikes, particularly heavily traded ones, can influence underlying order flow through hedging activity. Near certain strikes, dealers may adjust delta hedges in ways that add liquidity or remove it, which affects how the underlying responds to tests of nearby levels.
- Index events. Additions, deletions, and rebalances introduce predictable timing for flow. When these coincide with widely watched prices, congestion increases.
These structural patterns do not dictate outcomes, but they help explain why certain chart levels repeatedly attract attention and volume.
How Support and Resistance Appear on Charts
Charts translate the complex mechanics of order flow into visible patterns. Several recurring appearances are common across markets and timeframes:
- Horizontal zones at prior highs and lows. Price often hesitates when revisiting a former swing extreme. The hesitation can take the form of small-bodied candles, overlapping ranges, or multiple intraday tests.
- Role reversal. When price decisively moves through resistance and later returns to it from above, the old resistance often behaves as support. The inverse also occurs. Role reversal reflects a change in inventory: those who missed fills earlier use the return move to transact.
- Consolidation shelves. Trading ranges with several touches on both sides form shelves where volume accumulates. Breaks from a shelf often retest the shelf boundary before moving away again, although retests are not guaranteed.
- Round numbers and psychological markers. Levels such as 1.1000 in a currency pair or 100 in an equity frequently attract attention. The granularity depends on the asset’s price and tick size.
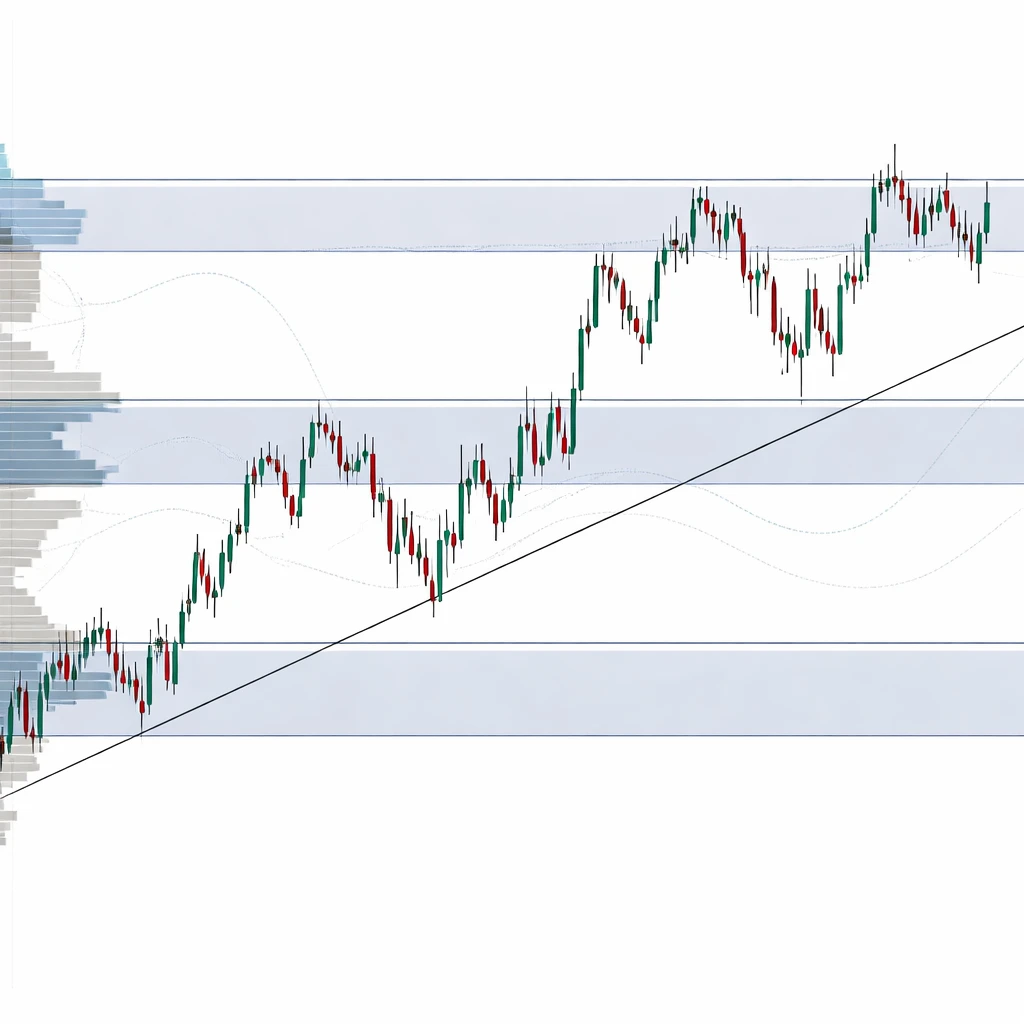
- Diagonal trendlines and channels. While horizontal zones are most discussed, angled boundaries can also behave as dynamic support and resistance when many traders draw similar lines through swing points.
- Moving averages as proxies. Commonly monitored moving averages sometimes act as dynamic zones where trading slows. The effect arises not from the averages themselves but from attention and order placement around them.
- Gaps and low-volume regions. Areas with little historical trading can prompt quick moves, while high-volume nodes on a volume profile can act as magnets or barriers.
None of these appearances guarantees a reaction. They indicate where reactions have been frequent historically and where two-sided participation is likely to increase.
Why Many Traders Pay Attention
Support and resistance provide a shared language for describing where liquidity may be concentrated and where price behavior may change character. Market participants monitor these zones to:
- Contextualize volatility. Price often moves more erratically when probing a significant zone, then becomes smoother once through it. This shift helps interpret changing risk conditions.
- Assess liquidity and slippage risk. The probability of partial fills or slippage can differ near levels where depth is uncertain and spreads fluctuate.
- Frame scenarios. Chart levels offer reference points for conditional thinking. If price remains below a known resistance region, the market is still contending with supply. If it holds above a former supply zone, the inventory picture may have changed.
- Standardize communication. Teams, risk committees, and analysts often describe market state using shared levels, improving clarity across diverse mandates.
Attention, in turn, can make the levels more meaningful. When many participants act on similar references, feedback loops arise that briefly stabilize or destabilize price around those references.
Practical Chart-Based Context
Consider an equity that advanced from 48 to 60 over several weeks. The first approach to 60 coincides with rising participation and a visible increase in intraday wicks, suggesting two-sided trade. Price pauses, pulls back a few points, then returns to 60 and briefly trades above it before closing below. The second approach reveals lighter follow-through and more overlap between consecutive candles. On the third approach, price finally closes above 60 on comparatively high volume and continues for several sessions.
In this sequence, the 60 region acted as resistance until enough buy volume arrived to absorb the resting sell orders. After the advance, a later pullback returned to 60. Price hesitated again but held above the level on closing basis. Many observers would say resistance “turned into support.” Microstructurally, some sellers who anchored to 60 either completed their orders or withdrew, while buyers who missed earlier entries became more willing to transact there. The shift reflected a change in inventory distribution rather than a mechanical rule.
Now consider a currency pair oscillating around 1.1000. Intraday order book depth frequently increases near the round number, and quote sizes fluctuate. Short-lived breaks on one side often revert quickly as stop orders trigger and then exhaust. Over time, traders mark a narrow band around 1.1000 as a region of interest. During a macro release, a decisive imbalance consumes the depth and carries price away from the area. On a subsequent day, the pair revisits the band, tests it once, and then continues in the new direction. The behavior reflects both concentrated liquidity at a salient round number and the ability of a macro shock to reset the balance of resting orders.
Why Levels Persist and Why They Fail
Levels persist when order flow repeatedly meets resistance or support at similar prices. The persistence is a product of memory and incentives. Participants who observed a level hold earlier may adjust their orders to take advantage of the perceived liquidity, reinforcing the level. In addition, algorithmic strategies that learn from recent microstructure patterns may adapt to supply more or less liquidity at those prices.
Levels fail when new information or a change in participation overwhelms the resting orders. A strong earnings report, a policy surprise, or a liquidity withdrawal can remove depth and allow price to traverse the zone quickly. Failures are often abrupt because stop orders accumulate near widely watched boundaries. Once triggered, they momentarily increase the urgency of market orders. The same dynamics explain overshoots, where price extends beyond the level before stabilizing.
Role reversal after a failure is common but not guaranteed. If a market advances through resistance and then holds above that region on a retest, the zone may function as support because inventory has shifted. If the retest cannot hold, the attempted shift in inventory was insufficient, and the prior zone may lose its relevance.
Multi-Timeframe Interactions
Support and resistance are not confined to a single timeframe. A level visible on a weekly chart can exert influence on daily and intraday behavior because many participants reference higher timeframes for context. Conversely, intraday levels can be meaningful for short-horizon participants without affecting longer-term charts. Confluence occurs when a price region aligns across timeframes, such as a daily swing high coinciding with a weekly consolidation boundary. Confluence attracts additional attention and can change the quality of price action around the level, often producing more tests, deeper wicks, or higher local volume.
Drawing and Interpreting Zones
Because exact prices rarely capture the complexity of order flow, many practitioners prefer zones to precise lines. The width of a zone can be informed by factors such as typical volatility, recent range, and how much time price previously spent trading there. Candle bodies and wicks both provide information. Bodies summarize where most trading occurred during a period, while wicks record excursions that were rejected. If a level is frequently pierced by wicks but respected by closes, the market is signaling brief liquidity imbalances that were subsequently absorbed.
Volume can help contextualize a zone without implying a specific outcome. Heavy volume near a level suggests active two-sided trade, while a low-volume traverse can indicate little interest at intervening prices. Volume-by-price tools highlight where trading has historically concentrated. High-volume nodes often coincide with consolidation shelves that behave as magnet-like areas. Low-volume regions are traversed more quickly, so support or resistance there may be more fragile.
The Role of News and Regime Shifts
News and regime changes can reorder the significance of historical levels. After a major earnings surprise, an economic regime shift, or a structural market change in liquidity provision, older levels may lose relevance. Alternatively, fresh levels may form around new reference points. The speed with which the market adopts new anchors depends on how widely the information is accepted and how capital constrained different participant groups are.
Cross-Market Considerations
Different markets exhibit the same underlying principles with distinct nuances:
- Equities. Opening auctions, closing auctions, and index rebalances add structure to intraday flows. Round numbers are often salient, and corporate events redefine reference levels.
- Futures. Contract roll and settlement procedures create periodic shifts in reference prices. Volume is concentrated in the front-month contract, which may alter how levels behave across rolls.
- Foreign exchange. The 24-hour session cycles through regional liquidity. Levels can behave differently during Asia, Europe, and North America hours because participation varies by region.
- Cryptoassets. Continuous trading without centralized auctions produces different intraday rhythms. Round numbers and exchange-specific liquidity pockets are prominent.
Common Misconceptions
Several misconceptions can impede clear interpretation of support and resistance:
- Precision. Levels are rarely exact. Treating them as points invites overconfidence in marginal breaches. The market often oscillates within a band before choosing a direction.
- Universality. A level that is important on one timeframe may be irrelevant on another. Context matters.
- Determinism. A reaction at a level does not prove causality. Many traders watched the area, but the exact mix of reasons varies from event to event.
- Strength from touches. More touches can mean more confirmation, but they can also represent consumption of available liquidity, which sometimes precedes a failure.
Interpreting Behavior Around Levels
Behavior around support and resistance often carries more information than the level itself. Market structure features worth observing include:
- Time spent at the level. Prolonged congestion suggests balanced two-sided participation. Quick rejection implies a strong imbalance.
- Order of tests. The sequence of approaches can reveal fatigue or building pressure. For example, progressively shallower pullbacks into a support zone indicate that sellers are being absorbed higher each time.
- Relative volume and volatility. Elevated volume with stable spreads signals deep two-sided trade. Elevated volume with widening spreads can signal urgency and thinning liquidity.
- Closes versus intraperiod extremes. Where price finishes relative to the zone often speaks to whether the test was accepted or rejected by the market.
These observations do not prescribe decisions. They refine interpretation of how the market is processing information and liquidity at a known reference point.
Limits of the Concept and Empirical Notes
The empirical literature on technical levels shows mixed results. Some studies document clustering of prices at round numbers and elevated activity around prior highs and lows. Others find that after accounting for transaction costs, the economic value of simple rules based solely on support and resistance is limited. These findings are not contradictory. They suggest that while levels reflect real frictions and behaviors, translating them into mechanical rules is difficult. Definitions vary, regimes change, and the distribution of outcomes is wide.
For analytical use, support and resistance function best as a framework for organizing observations about liquidity and participation. They summarize where the market has been forced to negotiate more intensely in the past and where it might do so again, conditional on new information and the current state of order flow.
Putting It All Together
Support and resistance form where liquidity concentrates and where participants share reference points. These regions emerge from a blend of microstructure, psychology, institutional practice, and information processing. On charts they appear as horizontal zones near prior extremes, shelves of consolidation, round-number areas, or dynamic boundaries such as trendlines and moving averages that many observers monitor. Their relevance is contextual, varying with timeframe, news flow, and the distribution of inventory across participants.
When price approaches such a region, the market often displays a change in character. Volume may increase. Spreads can fluctuate. Tests might be brief or prolonged depending on the willingness of participants to supply or demand liquidity at that price. A decisive move through a level can reset expectations and transform prior resistance into support or vice versa. Alternatively, a test can fail and reinforce the prior boundary. Neither outcome is guaranteed. The key point is that these zones mark places where the market tends to debate value more intensely than usual.
Key Takeaways
- Support and resistance form where liquidity clusters and where participants share salient reference points, not because of mechanical rules.
- Order book dynamics, behavioral anchors, institutional practices, and information flow jointly shape how levels emerge, persist, and fail.
- On charts, levels appear as zones near prior extremes, consolidation shelves, round numbers, trendlines, moving averages, and notable volume nodes.
- The behavior around a level time spent, volatility, volume, and the sequence of tests often provides more information than the level’s exact price.
- Levels assist in interpreting market context and potential liquidity conditions, but their relevance is conditional on regime, timeframe, and current order flow.