Support and resistance are among the earliest chart concepts students encounter. They are simple to draw and easy to observe. Price turns at a level, then turns again, and a horizontal line begins to feel meaningful. Over time, however, nearly every level fails. The line gives way, sometimes quietly and sometimes with force. Understanding why levels break is essential for interpreting price behavior with realism rather than mystique.
This article examines the concept of why levels break as an analytical framework rather than a trading tactic. The aim is to clarify what a break represents in terms of liquidity, information, and participant behavior; how the process appears on charts; and why market observers pay close attention to the conditions preceding and following a break.
Defining the concept: why levels break
Why levels break refers to the set of reasons that a previously effective support or resistance level ceases to hold. The concept is less about predicting an exact moment and more about recognizing the pressures that accumulate around a level and the signals that accompany a transition from balance to imbalance.
A support or resistance level holds when incoming orders on the defending side absorb or repel pressure. It breaks when that absorption is exhausted or withdrawn, or when new information prompts a decisive change in willingness to transact. The break is visible on charts as price moving beyond a well-watched boundary with evidence of follow-through or acceptance beyond that boundary.
Put simply, a level breaks when the balance of liquidity and intent shifts. That shift can be driven by order flow dynamics, inventory needs of participants, volatility regime changes, scheduled or unscheduled news, or structural alignment across timeframes. The precise mix varies, but the observable effect on the chart is a transition from containment to expansion.
Support and resistance as liquidity zones
It helps to think of support and resistance not as solid walls but as zones where liquidity is concentrated. Orders tend to cluster near obvious reference points, including prior swing highs and lows, round numbers, and gaps. These clusters exist because many participants anchor to the same visual cues and because risk management norms encourage defining risk near clear boundaries.
When price approaches such a zone, two types of orders often coexist. First, there are resting limit orders from participants willing to transact at the boundary. Second, there are conditional stop orders from participants who will exit if the level fails. If absorbing liquidity at the boundary is repeatedly depleted, remaining stops become the path of least resistance. That is one of the core reasons levels break, price reaches a pocket of one-sided orders and moves quickly through it.
Because these zones are visible and shared across market participants, they can act as magnets. Price may oscillate toward a level, pause, and test it several times as the market discovers how much liquidity truly sits there. Each test changes the local inventory, reducing the unknowns and often thinning the defense. A final test can tip the balance if little remains to absorb pressure.
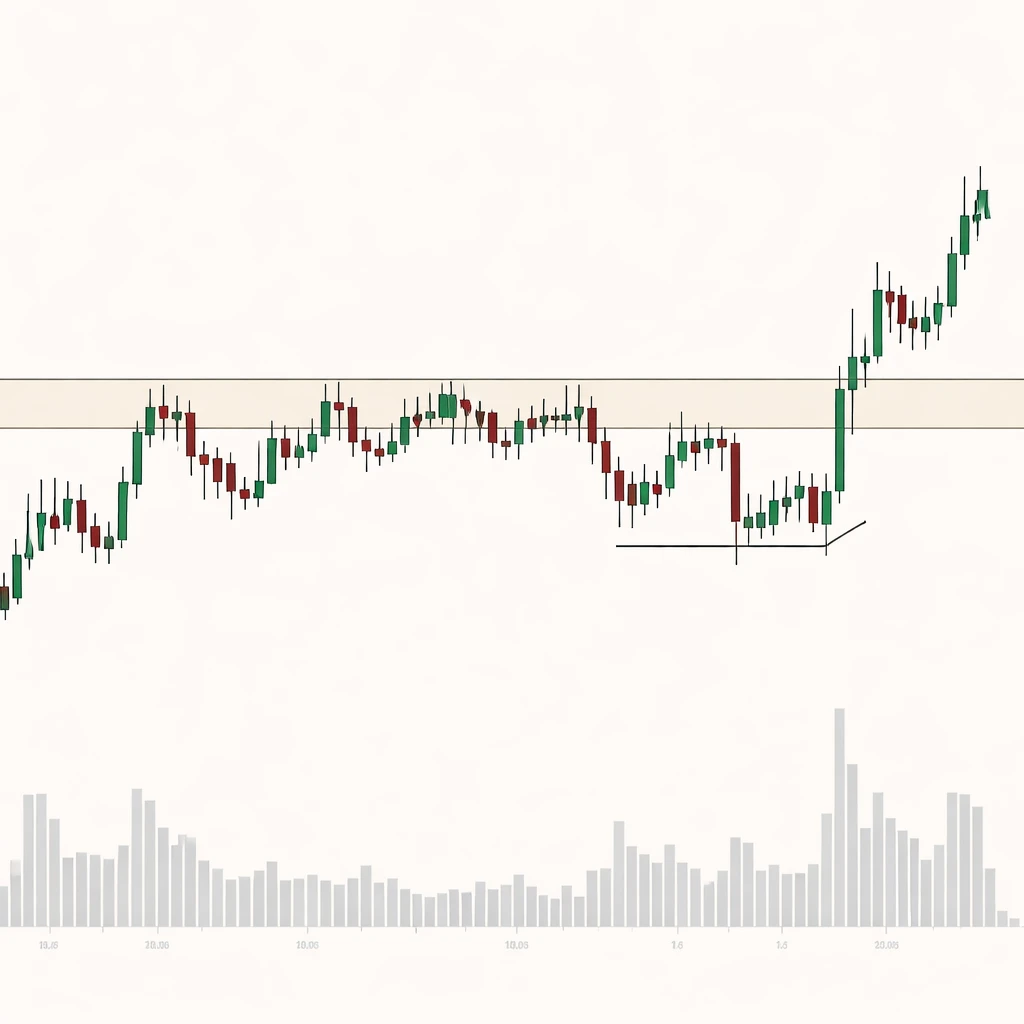
How a break looks on the chart
Pre-break compression and pressure
Before many breaks, charts display a pattern of increasing pressure against a boundary. Common features include:
- Higher lows pressing into a horizontal resistance, or lower highs pressing into a horizontal support.
- Contracting ranges, sometimes visible as a wedge or a tight consolidation near the level.
- Diminishing reaction away from the level with each test, which indicates that defending participants are getting less traction.
- Time spent near the level increasing, which suggests ongoing two-way trade but limited progress away from the boundary.
These features point to a market that has become locally balanced but is running out of room. A small exogenous impulse or a marginal increase in order flow can be sufficient to move price beyond the line.
The break event
The break itself can take several forms:
- Range expansion through the level, where the bar that crosses the boundary is wider than recent bars and closes beyond the level.
- Gapping through the level on open or after a news release, where there is little or no trade at the boundary because orders are repriced.
- Thin pass-through with modest range but limited opposing liquidity, often visible in a rapid sequence of prints with little overlap.
Volume context often matters. Relative volume that rises on the move through the level can signal that new participation is joining the move. Low volume breaks are not inherently weak, but they raise the possibility that the passage was achieved through a lack of opposition rather than strong initiative. The distinction affects how one interprets durability.
After the break: acceptance or rejection
Post-break behavior helps classify the event:
- Acceptance is indicated by sustained trade beyond the level, closes that hold beyond it, and the market building value on the other side of the line.
- Rejection involves a swift return back inside the prior range, often leaving a tail or wick through the level and little subsequent time spent beyond it.
- Retest behavior is common. After breaking resistance, price may revisit the area from above, or after breaking support, revisit from below. The way price responds to that retest provides information about whether the market now treats the area as a new reference point.
None of these outcomes is guaranteed. They are descriptive categories that organize what the chart communicates about agreement, disagreement, and participation after the boundary is crossed.
Factors that increase the chance of a break
Repeated tests and inventory dynamics
There is a popular saying that a level becomes stronger with every test. The evidence is mixed. Each test does confirm that participants care about the area, but each test also consumes resting liquidity and clarifies where stops are clustered. If bounces from support become shallower over time, buyers are either less aggressive or more fully invested. If pullbacks from resistance lose depth, sellers are either less enthusiastic or already short. Inventory exhaustion raises the likelihood that the next approach will find insufficient defense.
Volatility regime and compression
Breaks often coincide with a transition in volatility. A period of compression can precede expansion because the market uses up its ability to mean revert within a tight band. Once that band is saturated, a modest catalyst can initiate a larger-than-usual move. The move may be amplified by conditional orders triggering beyond the boundary, which adds mechanical follow-through to an initially small impulse.
Time and event catalysts
Scheduled events frequently reprice expectations, including earnings releases, macroeconomic data, policy announcements, and index rebalances. Unscheduled news can do the same. If a widely watched level sits near the price at the time of the event, the additional flow can tip the balance. The result can be a gap through the level or a fast passage with little opportunity for trade at the boundary.
Multi-timeframe alignment
When a horizontal level is visible on more than one timeframe, it attracts broader attention. A resistance on a daily chart, aligned with an intraday range high, invites participation from both slow and fast participants. Alignment can concentrate stops, and it can also concentrate attempts to defend. If the defense fails, the subsequent move can be larger because it contains the unwind of positions from multiple horizons.
Order book depth and resting interest
In markets where level two or depth-of-book data is available, thinning depth near a level can precede a break. Resting orders may be pulled ahead of news or after a failed defense. On the other hand, absorption by large hidden or iceberg orders can temporarily hold a level without visible size. If absorption stops appearing and there is no longer a sponsor to defend, price can slip through quickly. The chart records this as a swift move with limited rotation at the boundary.
False breaks and failed moves
Not every excursion beyond a level signals a new directional phase. A false break occurs when price trades beyond a boundary but fails to attract follow-through, then returns inside the prior range. Several mechanisms can produce this pattern:
- Stop runs into opposing liquidity, where triggering stops provide the fuel to reach better liquidity on the other side, after which price reverses.
- Absorption by large passive participants, where significant resting interest counters the breakout and contains it.
- Information vacuum, where no new participants join after the level is crossed, leaving the move underpowered.
On charts, false breaks often leave wicks and limited body closes beyond the level. The duration of time spent beyond the line is short relative to the time spent approaching it. This does not imply predictability, but it helps classify price action and contextualize why a single print or intrabar poke is not necessarily decisive.
Why market observers pay attention to breaks
Breaks are focal points because they often coincide with changes in participation and risk transfer. Several analytical benefits follow:
- Clarity of information. A break that holds signals that some participants have repriced their views enough to transact beyond a widely watched boundary. It is a visible record of changing beliefs.
- Shift in balance of power. If resistance fails and price accepts higher, it suggests buyers were willing to pay up and sellers stepped back. If support fails and price accepts lower, it suggests sellers were motivated and buyers withdrew.
- Volatility and path. Breaks can lead to different volatility characteristics, including range expansion, directional persistence, or increased two-way trade during retests. Recognizing the shift helps frame expectations for the path rather than just the destination.
- Post-break reference points. The broken level, and any immediate structures built around it, become new references for reading acceptance or rejection.
Practical chart-based context and examples
Daily range with an earnings catalyst
Consider a stock that has respected a defined range for several months, with resistance near a round number. In the weeks before earnings, daily candles compress and reactions off resistance shrink. The earnings release prompts a gap open above the level. On the chart, the gap leaves little or no trade at the boundary, followed by sustained trade and closes above the prior resistance. Here the break reflects a discrete information update that changed participants willingness to transact. The prior level did not fail at random. It failed because the distribution of beliefs about future cash flows shifted abruptly.
Intraday pressure into the session high
On an intraday index future, the morning builds a balance with a clear session high. As midday approaches, higher lows press against that high while realized volatility drops. Depth thins near the top of the range. A modest buy program or a cluster of stops above the high propels price a short distance beyond the level. If new volume joins, the chart shows range expansion and time building above the old high. If little joins, price often returns into the prior balance. The outcome illustrates whether the break tapped into new participation or just harvested nearby orders.
Commodity near a widely watched round number
A commodity future approaches a round number that has turned price multiple times over the year. As it nears the figure again, the market has fewer sellers left who are willing to lean against it. A small external catalyst pushes price through the figure during a thin period. The chart displays a burst of range, followed by a pause. If subsequent sessions continue to build value above the figure, the market has accepted the new area. If not, the initial passage may be recorded as a tail that marks a failed attempt.
Currency pair during a macro release
A currency pair sits just above multi-week support ahead of a major inflation report. The release surprises to the upside, repricing rate expectations. The pair gaps down through support in the first minute after the number. Because many conditional orders were positioned just below the level, the move accelerates. The chart shows a sequence of candles with little overlap until a new balance emerges several handles lower. The level broke because both information and mechanics aligned, new beliefs plus clustered stops produced a one-sided flow.
Reading break strength without prediction
After a boundary is crossed, several chart-based observations help classify the event without assuming a forecast:
- Closes versus wicks. Repeated closes beyond the level, rather than just intrabar probes, indicate acceptance. A sequence of wicks that fail to close shows hesitation.
- Time beyond the level. The longer price auctions beyond the boundary with two-way trade, the greater the evidence of acceptance.
- Relative volume. Volume that is above recent averages during and after the break suggests participation. Very low volume raises the possibility of a vacuum that could be filled in either direction.
- Range structure. Expanding true range following the break signals a volatility shift. Persistent narrow ranges after a break often precede a decision to either continue or revert.
- Breadth and correlation. In equity indices, a break with broad participation across constituents offers different information than a break driven by a small subset. In cross-asset contexts, confirming moves in related markets can indicate whether the break has macro sponsorship.
Common misconceptions
Myth 1: Levels are inherently strong because they held before. Levels are strong only while willing participants defend them with sufficient size. Each test changes that condition. A past pivot is not a guarantee of future durability.
Myth 2: The more a level is tested, the stronger it becomes. Frequent tests can mean importance, but they also deplete resting interest and reveal where stops lie. Whether that strengthens or weakens a level depends on who is defending and who is motivated.
Myth 3: A single print beyond a level proves a break. Markets often probe to discover liquidity. A brief excursion beyond a line without acceptance does not redefine the structure. Closes, time, and subsequent value building provide stronger evidence.
Myth 4: Breaks require high volume. Some breaks occur on thin liquidity rather than heavy participation. They can still travel far initially. The question is durability, which is better assessed by whether new trade continues to occur beyond the level.
Integrating the concept into analysis
Understanding why levels break refines how one organizes chart information. Several practical analytical habits follow from the concept:
- Frame levels as zones rather than precise ticks, since liquidity is distributed in ranges and can shift slightly with context.
- Observe how reactions from a level change over time. Diminishing reactions, greater time spent at the boundary, and compression can indicate rising pressure.
- Track upcoming events. A level that aligns with a scheduled catalyst may experience a break driven by new information rather than by slow accumulation alone.
- Note multi-timeframe alignment. When a boundary matters on both daily and intraday charts, flows from different participant types can interact at the same place.
- Treat the aftermath of a break as a new information set. Acceptance or rejection is part of the story, not an afterthought.
These habits do not forecast outcomes. They organize observation so that when a break occurs, its character is easier to interpret.
Limitations and uncertainty
Technical levels exist within a broader market ecology. Fundamental news can override chart structure without warning. Liquidity conditions can change during the day due to exogenous flows, including hedging programs and rebalancing. Algorithmic activity can alter the order book in ways that are not obvious on a static chart. Moreover, the same visual pattern can lead to different outcomes because the participants standing behind the orders change over time.
For these reasons, the concept of why levels break should be handled as a descriptive framework. It identifies the forces that might be at work and provides a language for classifying what has happened. It does not imply certainty and it does not prescribe actions.
Summary perspective
Support and resistance levels persist only while market participants choose to defend them with sufficient liquidity. Breaks happen when that defense withdraws, is exhausted, or is overwhelmed by new information. Charts record this shift through structural clues before the break, characteristic signatures during the break, and acceptance or rejection afterward. By paying attention to these features, an analyst reads the market as a continuous process of negotiation rather than as a set of fixed barriers.
Key Takeaways
- Levels break when liquidity and intent shift, often due to exhaustion, new information, or conditional orders triggering beyond the boundary.
- Pre-break signs can include compression, repeated tests with diminishing reactions, and increased time spent at the level.
- The break event varies, from range expansion and strong closes to gaps that skip the boundary, and volume context helps classify durability.
- Post-break behavior, including acceptance, rejection, and retests, provides evidence about whether the market has embraced the new area.
- The concept is an interpretive framework, useful for reading structure and participation, not a predictive or prescriptive trading rule.