Resistance is a foundational concept in technical analysis. It refers to a price area where upward movement tends to slow, stall, or reverse because selling interest outweighs buying interest. Analysts look for resistance to help interpret where supply might reassert itself, how participants are reacting to prior price history, and where price action has repeatedly met difficulty advancing. The concept does not predict outcomes. It organizes information about past behavior into reference points that traders use to understand present conditions.
Definition and Core Idea
Resistance is a price level or zone that has historically contained advances. When price approaches that level from below, selling pressure, profit taking, or the closing of long positions tends to increase. That behavior can arise from many sources, including investors seeking to exit at prior break-even points, participants who perceive the asset as expensive at that level, or algorithmic systems that respond to price references.
It is helpful to think of resistance as a region rather than a single price. Markets trade through ticks that include highs and lows, intraperiod fluctuations, and gaps. A precise horizontal line implies an exact boundary, but in practice resistance often spans a band around notable highs, round numbers, or historical congestion. Within that band, the balance of orders has often leaned toward supply over demand.
Why Resistance Matters in Analysis
Analysts monitor resistance because it concentrates attention and orders. Price references simplify decision making for many participants, which creates clustering of behavior. When many market participants have been watching the same prior high or the same zone of rejected advances, the likelihood of heavier transactions near that area increases. The result is often a visible change in volatility, the tempo of the tape, or the character of the trend as price approaches that area.
Resistance also provides context. Without reference points, a price chart is a continuous stream of fluctuations. Marking resistance helps contextualize where the market has previously found supply. This can help frame scenarios for both continuation and failure of advances, which is informative even in the absence of a trading strategy.
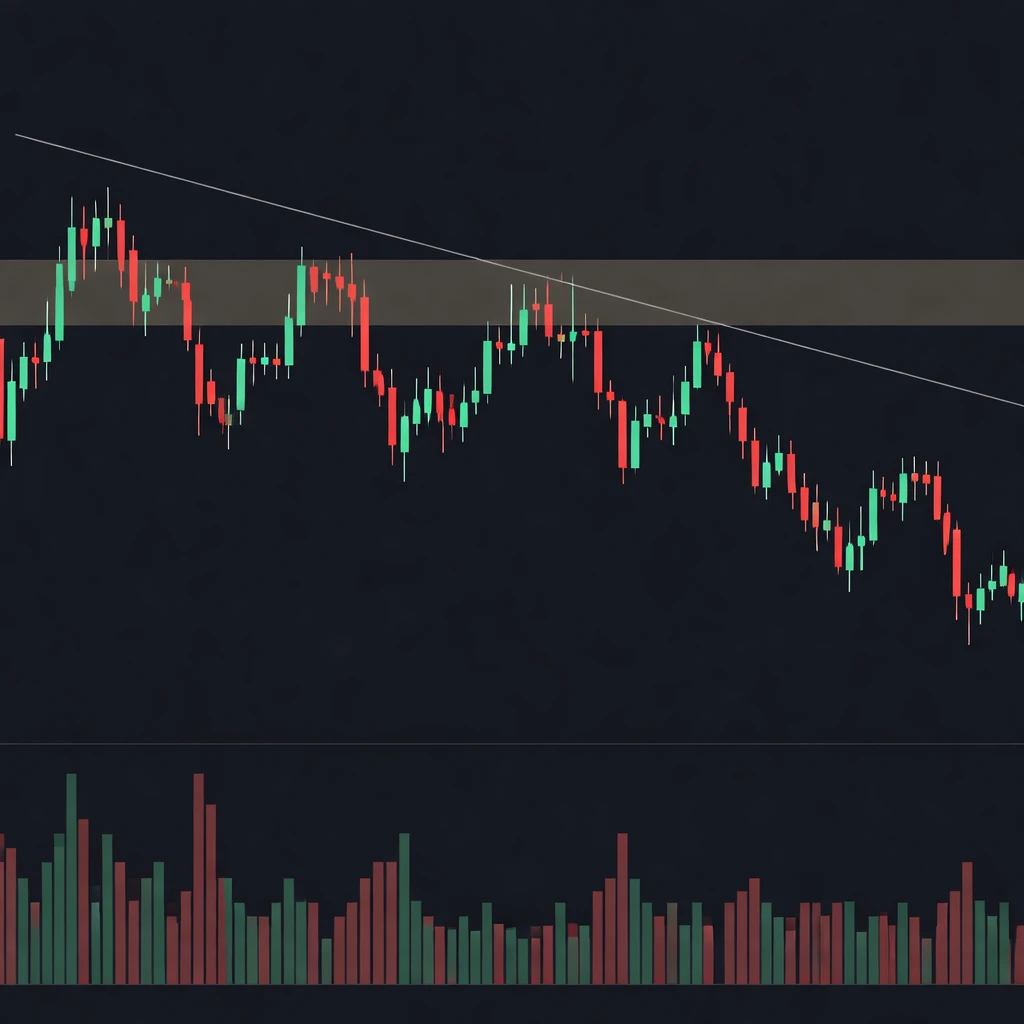
How Resistance Appears on Charts
On a typical candlestick or bar chart, resistance tends to appear as a ceiling formed by prior swing highs, clusters of highs over a range of bars, or a trendline connecting lower highs in a downtrend. Visual cues include repeated upper wicks that penetrate a similar area and then retreat, gaps that have not been filled, or a volume buildup near a prior high.
Horizontal Price Ceilings
Horizontal resistance is the most common form. If an asset has rallied to 50 on three separate occasions and subsequently pulled back each time, the area around 50 is likely to be recognized as resistance. The exact boundary might vary by a few cents or points. What matters is the repeated failure to close and hold above that band.
Zones Rather Than Lines
Markets rarely respect a single price to the tick. Consider a stock that topped at intraday highs of 49.80, 50.10, and 50.05 over a two month span. A reasonable resistance zone could span roughly 49.80 to 50.10, capturing the range where supply previously appeared. Emphasizing zones helps prevent overinterpretation of marginal penetrations that do not lead to sustained progress.
Multiple Tests and Character
Repeated tests of a resistance area are a common feature. Each approach can reveal new information about market character. For example, if the first test results in a sharp rejection on heavy volume, and a later test results in only a modest pullback with lighter volume, some analysts infer evolving participation and possibly reduced supply. This is not a forecast. It is an observation about how the interaction between price and volume can change over time.
Underlying Mechanics
Several forces can create or reinforce resistance. None of them acts in isolation, and not all episodes of resistance share the same drivers.
Order Flow and Supply
Resistance occurs where there is enough sell pressure to absorb buy orders. Sellers may be motivated by profit taking near prior highs, risk control mandates, or valuation concerns. Limit sell orders placed in advance can accumulate near obvious reference points, which increases the probability of a pause or reversal when price reaches that area.
Anchoring and Reference Points
Anchoring to previous highs is common. Participants who watched price fail at a prior level may treat that level as important when price returns. Investors who held through a decline and see price revisit their entry or break-even often choose that moment to reduce exposure, adding to supply.
Liquidity and Market Microstructure
Liquidity tends to concentrate near visible reference levels. As price approaches resistance, order books often thicken. That depth can slow further ascent unless incoming demand is strong enough to trade through it. In some cases, the process of trading through the liquidity results in short-term whipsaws as orders are matched, canceled, or re-posted.
Types of Resistance
Resistance can be categorized in several practical ways. These categories focus on how the level is derived from price history.
Horizontal Resistance from Prior Highs
Prior swing highs, whether from a single strong pivot or a plateau of highs, are the most straightforward form. Analysts typically identify these highs on the timeframe they are studying and treat the cluster of highs as a reference zone.
Trendline and Channel Resistance
In downtrends, a line drawn across descending swing highs can define a sloping resistance. Channels that connect lower highs and lower lows produce an upper boundary that functions as resistance as price rallies from the lower boundary. These lines are interpretive tools, so their placement depends on the analyst’s selection of pivots and tolerance for overshoots.
Dynamic Resistance from Moving Averages
Moving averages can act as dynamic resistance when price is below the average. The average reflects a smoothed measure of recent price, and many participants monitor well known averages. When large numbers of traders watch the same reference, behavior can self reinforce. It is important to remember that averages lag price and that any perceived resistance effect depends on market context.
Gaps and Unfilled Windows
Price gaps, which leave visible windows on the chart, can attract attention as resistance when price approaches from below. The lower edge of a downside gap may function as an initial boundary. Sometimes price slices through quickly, other times it hesitates as orders concentrate around the gap area.
Round Numbers and Historical Landmarks
Psychologically significant numbers such as 100, 1000, or 1.2000 in currency pairs often gather orders. All time highs and decade highs are also closely watched. The effect is not mechanical, yet it appears frequently enough to be relevant in many markets.
Timeframes and Aggregation
Resistance is timeframe specific. A level that is significant on a weekly chart may not be obvious on a five minute chart, and vice versa. Because many participants reference different horizons, resistance on higher timeframes can have stronger influence on intraday behavior. When a daily or weekly resistance zone aligns with an intraday swing high, analysts sometimes call this confluence. The presence of confluence does not guarantee outcome. It highlights that multiple observer groups may focus attention on the same area.
Aggregation also matters. Daily closes compress intraday volatility into a single bar. A weekly chart may show a clean rejection at a level, while the daily chart reveals multiple penetrations and reversions within that week. When marking resistance, the timeframe used to define the level should match the timeframe of the analysis being conducted.
Drawing and Interpreting Resistance
Identifying resistance involves selecting representative highs and defining a zone around them. There is judgment involved, and different analysts may mark slightly different areas. Despite this subjectivity, a disciplined approach can improve consistency.
Selecting Highs
Many analysts focus on visible pivot highs, where a rally ended and was followed by at least a few bars of decline. Others consider congestion highs, where several bars failed in a narrow range. Both are valid. The choice depends on the character of the market and the timeframe considered.
Wicks, Closes, and Zone Breadth
Whether to anchor a line to intraday highs or to closing prices is a common question. Intraday extremes capture the furthest reach of buying before rejection, while closes capture where consensus settled at the end of the bar. A practical method is to treat the full span between the cluster of highs and the cluster of closes as the operative zone. The breadth of the zone should reflect typical volatility on that timeframe. Very narrow zones on volatile instruments lead to frequent whipsaws and little interpretive value.
Adjusting as New Data Arrives
Resistance is not permanent. As new highs are formed or old levels are traded through and accepted, the relevant reference points shift. Marked levels should be updated to reflect the most recent interactions that attracted meaningful volume or produced visible changes in behavior.
Confluence With Other Information
Some analysts note when resistance coincides with other references, such as a long term trendline or a widely observed moving average. Confluence is an observation that several lenses point to the same general area. It does not imply a prescribed action. It can, however, raise the likelihood that more participants are focused there, which sometimes manifests as greater activity and sharper reactions.
Resistance, Breakouts, and False Breaks
Breakouts refer to advances that trade above resistance and sustain progress. False breaks occur when price pushes above resistance briefly but then returns below the zone. The distinction between the two is only clear with hindsight. Analysts therefore often study how price behaves around the level rather than attempting to label each event in real time.
Volume analysis can be informative in this area. When price approaches resistance on rising volume and breadth, the advance has strong participation. If price pokes above the level on limited activity and quickly reverses, some infer a lack of demand at higher prices or the presence of supply that was not fully visible in the order book. Again, these are interpretive cues, not certainties.
Retests of a level after price trades above it are common topics in technical literature. The idea is that prior resistance can later function as a decision area. Empirically, markets sometimes interact with the former resistance area before continuing, and sometimes do not. What matters for analysis is observing how acceptance or rejection plays out around that historically important area, not assuming a particular outcome.
Practical Chart-Based Examples
Example 1: Equity Near a Repeated High
Assume a large capitalization stock rallied to the area around 50 three times over six months. Each time it traded into the 49.80 to 50.20 zone, upper wicks formed on the daily candlesticks, and the stock retreated several percent. Daily volume during prior attempts was noticeably higher on the approach than on the subsequent pullbacks. Analysts would likely mark 49.80 to 50.20 as resistance. When the stock later approaches 50 again, attention may increase, and market depth may thicken as participants revisit the prior ceiling. Whether price ultimately trades through or retreats is contingent on the balance of orders at that time, which cannot be known in advance.
Example 2: Currency Pair and a Round Number
Consider a currency pair that has oscillated between 1.1600 and 1.2000 several times. The zone around 1.2000 has a history of intraday spikes that tend to fade by the daily close, leaving long upper wicks during prior attempts. The round number also aligns with a downward sloping trendline drawn from two earlier lower highs on the weekly chart. In this situation, both the round number and the trendline point to the same area of interest. If price approaches 1.2000 again, some analysts would anticipate more active order flow, wider spreads during the approach, or short-term volatility, precisely because many participants watch the same reference.
Example 3: Futures Contract and Gap Resistance
Imagine an index futures contract that gapped down from 4200 to 4100 several weeks ago during a risk-off episode, leaving a visible gap on the daily chart. Subsequent trading churned below 4100, then advanced back toward the lower edge of the gap near 4100 to 4120. As price presses into that area, the tape hesitates, trading becomes two sided, and depth thickens on the order book. Some orders likely cluster at the lower gap boundary because participants often treat gaps as unfinished business. Whether the gap eventually fills depends on fresh demand, not on the existence of the gap alone.
Limitations and Misconceptions
Resistance is not an impenetrable ceiling. Strong trends can slice through well defined levels. Conversely, quiet markets can turn lower without ever reaching an obvious resistance. Treating resistance as deterministic leads to overconfidence and misinterpretation.
Another misconception is that any touch of a resistance level has the same interpretive weight. Context matters. The character of the approach, the broader trend, the pace of advance, and the participation all influence how informative a given interaction may be. A thin overnight test in futures is not equivalent to a full regular session test with significant volume.
Hindsight bias also looms large. After a reversal near a level, it is tempting to declare that level as obvious. In real time, charts contain many potential reference points. Selecting only the ones that worked after the fact gives a false sense of clarity. A disciplined approach requires marking levels in advance according to consistent rules and accepting that many marked levels will pass without dramatic events.
A final limitation is subjectivity. Two experienced analysts can draw slightly different zones and still both be reasonable. The goal is consistency and clarity of process, not perfect agreement.
Why Market Participants Pay Attention
Several practical considerations explain why resistance remains central in chart based analysis.
First, resistance condenses significant history into a reference zone that is easy to communicate and monitor. When a commentator notes that an index is approaching its prior high, thousands of readers quickly understand the implication.
Second, resistance helps frame competing scenarios. Analysts can evaluate how the market behaves as it approaches the level, whether the advance is orderly or stretched, and whether new information alters the balance of orders. The level is a stage on which behavior becomes easier to read.
Third, resistance often aligns with risk management processes used by institutions. Policies that cap exposures at certain price landmarks or require reassessment near prior highs can lead to predictable behavior clustering. This institutional dimension magnifies the visibility of resistance.
Data Quality and Charting Practices
Reliable analysis depends on accurate data and appropriate chart settings. Adjusted data for corporate actions, such as splits and dividends, can change the appearance of historical highs. In futures, continuous contract stitching methods may alter where gaps and highs appear. For currencies, different data feeds can show minor differences in highs due to varied liquidity sources and session times. These details matter when marking precise reference zones.
It is also important to consider session boundaries. Many instruments trade nearly around the clock, yet market tone can differ between regular sessions and overnight trading. A resistance level defined in the low liquidity hours may carry less weight than the same level tested during the most active session when participation is broad.
Finally, matching the granularity of the analysis to the instrument’s volatility is essential. Highly volatile assets often require wider resistance zones to avoid overinterpreting noise. Quiet, liquid instruments may permit tighter zones.
Integrating Resistance Into Broader Analysis
Resistance is one element of a broader analytical framework. Many analysts consider trend, momentum, volatility, and macro or fundamental context alongside support and resistance. A level that appears technically significant can be reinforced or diminished by other information. For instance, a notable resistance zone arriving during a period of major news flow may behave differently from the same zone during a quiet period.
It is also common to study how price behaves after interacting with resistance. Does the market accept higher prices and build value above the level, or does it reject the area and revert quickly? Acceptance and rejection are useful interpretive concepts. Acceptance implies that the market is willing to transact in size at new levels, often visible as time spent and volume accumulated above the former ceiling. Rejection implies swift return to the prior range with little time spent above the level.
Common Pitfalls to Avoid
Several mistakes recur among new chart readers when working with resistance.
Overfitting is one. If too many lines are drawn, any price action can be made to appear consistent with a resistance narrative. A clean chart with a small number of well justified levels is more informative than a cluttered chart with lines at every minor high.
Another pitfall is ignoring volatility. Setting a one point resistance zone on an instrument that routinely moves three points in a minute invites confusion. The width of a zone needs to reflect the instrument’s typical range and the timeframe used.
A third mistake is assuming that every interaction with resistance will be dramatic. Often price simply pauses, rotates slightly, and then continues. Expecting large moves at every level can bias interpretation and lead to exaggerated conclusions from normal noise.
Event Risk and Evolving Levels
Economic releases, earnings reports, regulatory announcements, and other discrete events can change the importance of resistance. For example, an earnings surprise can reprice an equity and invalidate a previously respected ceiling. Similarly, central bank policy updates can alter currency dynamics around a long observed round number. Levels are not sacred. They reflect the accumulation of past interactions, and new information can reset the market’s reference framework.
After major events, it is prudent to reexamine how price interacts with former resistance areas. Sometimes a level that mattered for months becomes irrelevant overnight. At other times, it retains influence because participants still reference it when making decisions. The chart reveals which case applies through subsequent behavior.
Putting It All Together
Resistance encapsulates how markets remember. Price history leaves visible landmarks. When price returns to those landmarks, behavior often becomes more predictable in form if not in outcome. Observers watch for the familiar patterns of hesitation, absorption, rejection, and acceptance. None of these patterns ensures a future path. They serve to organize thinking, to focus attention, and to frame what the market must do to demonstrate change.
Key Takeaways
- Resistance is a price level or zone where prior advances stalled, reflecting an area where supply has outweighed demand.
- On charts, resistance appears as horizontal ceilings, sloping trendline boundaries, gap edges, round numbers, or dynamic references such as moving averages.
- Analysts focus on resistance because attention and orders cluster near visible reference points, often changing volatility and market character.
- Resistance is context dependent and timeframe specific, best treated as a zone that adapts with new information rather than a single fixed price.
- Interactions with resistance reveal behavior about acceptance or rejection of higher prices, which informs analysis without prescribing actions.