Support and resistance levels provide structure to otherwise complex price movement. Not all levels carry equal weight, however. The timeframe used to define a level changes how many market participants notice it, how much information it aggregates, and how price tends to behave around it. Understanding the timeframe importance of levels gives a clearer reading of price behavior and reduces confusion when lower timeframe fluctuations conflict with higher timeframe context.
Defining Timeframe Importance of Levels
Timeframe importance of levels refers to the observation that support and resistance identified on higher timeframes, such as weekly or daily charts, often exert more influence on price behavior than levels drawn on lower timeframes, such as 15-minute or 5-minute charts. The reason is rooted in data aggregation, market attention, and the mechanics of how closes and reference points form on different horizons.
A level on a weekly chart incorporates many days of trading and reflects a broader consensus of value. A comparable level on a one-hour chart incorporates far fewer transactions and a shorter segment of market participation. When price approaches a well-defined weekly level, reactions often appear across several lower timeframes. When price approaches a level defined only on a five-minute chart, the effect tends to be more local and transient.
Why Timeframe Matters for Support and Resistance
Data Aggregation and Sample Size
Higher timeframe candles summarize larger samples of trades. A weekly swing high or low forms after a full week of order flow, across multiple sessions and news cycles. This aggregation reduces random noise. Lower timeframe extremes can form from a single burst of activity, such as a news headline or a liquidity gap within one session. Levels derived from larger samples tend to be more durable.
Visibility and Market Attention
Many analysts and institutions monitor daily and weekly charts. A level visible to a wider audience becomes a shared reference point. This visibility does not guarantee a reversal, but it increases the chance that price pauses, consolidates, or shows hesitation as orders cluster around that area. In contrast, a level seen only on a five-minute chart may be overlooked by participants who operate on daily or weekly schedules.
Close-Based Reference Points
Closes on higher timeframes are commonly used in reports, models, and portfolio processes. Whether a weekly close occurs above or below a prior high can influence how participants update their reference levels. Intraday movement that briefly trades beyond a weekly level but closes back within the range often carries less information than a decisive weekly close beyond the level. This does not prescribe an action. It simply clarifies why closes from higher timeframes are emphasized when interpreting structure.
Noise Filtering and Durability
Lower timeframes capture many micro-movements that later compress into a single higher timeframe bar. A five-minute thrust may look significant locally, yet it can become a small wick on the daily chart. The higher timeframe view filters out that noise, which is why a level that persists across several daily or weekly closes often proves more consequential than a level that appears only in intraday snapshots.
How Timeframe Importance Appears on Charts
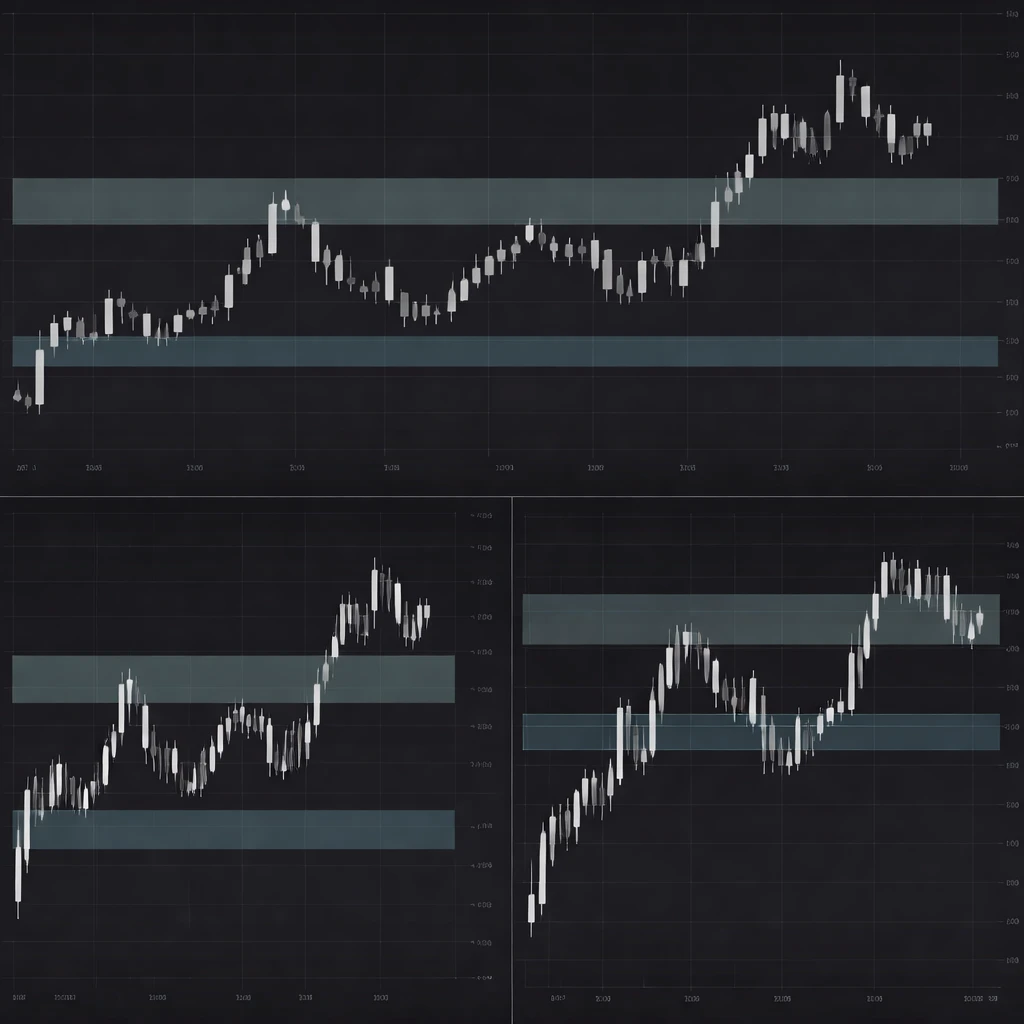
The concept becomes evident when the same market is viewed through multiple lenses. Consider three panels: a weekly chart, a daily chart, and an hourly chart of the same instrument.
- On the weekly chart, a horizontal zone marks a prior cluster of highs where price stalled for several weeks. The zone is broad because weekly swings rarely point to a single price; they reflect an area.
- On the daily chart, as price approaches the weekly zone, individual days often show smaller bodies, overlapping ranges, or long wicks. This indicates hesitation and two-sided activity near the higher timeframe reference.
- On the hourly chart, price may test the same zone many times in quick succession, temporarily poking through and then returning, creating an intricate pattern of minor support and resistance around the boundary of the weekly area.
Across these panels, the higher timeframe zone often acts as a focal point. Lower timeframe support and resistance structures tend to form and reform around the higher timeframe boundary. Even when the level ultimately gives way, the process around it frequently includes pauses, consolidations, and failed attempts that are clearer on the hourly or 15-minute chart.
Levels as Zones Rather Than Single Lines
Levels from higher timeframes are not single-price barriers. They are usually zones defined by clusters of highs, lows, or closes. The width of the zone tends to scale with timeframe because higher timeframe swings are broader. Representing a weekly level as a narrow line leads to the impression of frequent false breaks. Representing it as a zone allows for typical overshoot and negotiation without implying an error in the level itself.
Round numbers often play a role in how zones are perceived. Prices near 100, 1,000, or other round figures attract attention, especially on higher timeframes, because they are easy reference points in communication and reporting. Round numbers alone do not make a level important, but round numbers that coincide with prior weekly swing points tend to be more visible and often draw more order flow.
Practical, Chart-Based Context
Imagine an index futures contract with a clearly defined weekly resistance zone centered near 4,200. Over several months, weekly candles test this zone and close below it. The daily chart later shows an advance back into the same area from 4,100. As price approaches 4,180 to 4,220 on the daily chart, volatility compresses, daily ranges narrow, and several days close with long upper wicks. The hourly chart within those same days reveals repeated pushes to 4,210 to 4,215 that fail to hold. A few hours later, price returns to the middle of the zone around 4,200. This pattern communicates that a larger reference level is influencing shorter-term activity.
In a second case, consider a large-cap equity with a weekly support zone near 150 formed by a multi-month base. A quarterly earnings release triggers an intraday drop to 148 on the five-minute chart. During the session, price trades below the weekly zone for fifteen minutes, then stabilizes and closes the day at 151. The weekly candle ultimately closes at 152, back inside the support area. On the weekly chart, the move appears as a lower wick testing the zone. On the five-minute chart, the same move appears dramatic. The higher timeframe close provides context, indicating that the weekly support has not yet been accepted as broken.
Neither of these examples indicates what should happen next. They illustrate how a level defined on a higher timeframe tends to organize price behavior on lower timeframes and how intraday excursions beyond such a level can look different once compressed into a daily or weekly close.
How Levels Form Across Timeframes
Structural Swings
Support and resistance often originate from structural swings, where price reverses direction and leaves a visible pivot. On weekly charts, these pivots usually form after extended moves. On intraday charts, they can appear within a single session. The longevity and influence of a pivot tend to be greater when it forms on a higher timeframe and is reinforced by later interactions.
Consolidation Boundaries
Ranges create clear upper and lower boundaries. When a weekly range forms, its edges can influence daily and intraday trading for a long period. A fifteen-minute range can matter locally, but it may be absorbed within a single daily bar. Recognizing which range boundary governs a current move clarifies why price pauses at certain places and ignores others.
Gaps and Session Effects
Markets with defined sessions, such as equities, produce gaps between the prior close and the next open. Gaps that align with higher timeframe zones can add attention to those areas. In continuous markets such as foreign exchange or many futures contracts, gaps are less frequent, and levels are often defined more by swing structure and round numbers than by session gaps.
Reading Price Behavior Near Higher Timeframe Levels
When price approaches a major daily or weekly level, several behaviors are common:
- Lower timeframe volatility often changes as the level nears. Ranges can contract before a test or expand during a test, producing long wicks.
- Market participants may fade or press into the level intraday, leading to multiple probes on hourly and five-minute charts. These probes can produce short-lived breaks that do not carry through to the higher timeframe close.
- Consolidation can form just below resistance or just above support. This positioning can precede continuation or rejection. The higher timeframe close relative to the zone provides the cleanest record of acceptance or rejection, independent of intention.
None of these behaviors predicts direction. They help explain why the same price action can look decisive on a five-minute chart and ambiguous on a daily chart. The timeframe that defines the level governs the proper frame of reference for interpreting the move.
Confluence and Conflict Across Timeframes
Confluence occurs when levels from multiple timeframes cluster in a similar area. For example, a weekly resistance zone near 4,200 that aligns with a daily swing high near 4,195 and a visible hourly supply area near 4,205 creates a band that multiple groups of market participants may observe. Reactions in such areas often display complex lower timeframe choreography, with several intraday tests and counter-moves as orders from different horizons interact.
Conflict occurs when lower timeframe trends press strongly toward a higher timeframe level that faces the opposite direction of the lower timeframe impulse. In these cases, intraday momentum can carry price into a higher timeframe zone, yet the daily or weekly close fails to confirm a break. The apparent contradiction resolves when the move is seen through the higher timeframe lens.
Breaks, Closes, and Role Reversal in a Timeframe Context
A break above resistance or below support is widely discussed, but its meaning depends on timeframe. Intraday moves beyond a weekly level are common. Until a daily or weekly close occurs beyond that level, the higher timeframe record does not register a completed break. Once a higher timeframe close occurs, prior resistance frequently functions as potential support on subsequent pullbacks, and prior support can function as potential resistance on bounces. This is often called role reversal. The visibility and durability of role reversal tend to increase with the timeframe of the level that was broken and closed beyond.
It is important to treat role reversal as descriptive, not prescriptive. It explains why price often pauses when revisiting a level that was recently surpassed on a higher timeframe. It does not imply an expected outcome for any specific test.
Precision, Tolerance, and the Width of Higher Timeframe Zones
Because higher timeframe levels represent broader areas, precise single-price triggers are rare. Expecting the market to react at the exact high of a weekly range can lead to the impression of frequent failure, when the actual behavior is consistent with a wider zone. Many practitioners draw zones that cover the cluster of highs and lows around the pivot. On lower timeframes this zone appears thick and may encompass several minor swing points. Interpreting reactions within the zone requires acknowledging that short-term probes and whipsaws can be normal when a large number of orders converge.
A Step-by-Step Multi-Timeframe Map
Consider a hypothetical mapping process as an interpretive framework. First, identify major weekly zones where several weekly candles stalled or reversed. Next, on the daily chart, note the most recent swing highs and lows that sit just inside those weekly boundaries. Finally, on the hourly chart, mark the minor levels that formed during the most recent approach to the higher timeframe zone. This produces a nested map where the weekly zones define the outer frame, the daily levels define medium-term structure, and the hourly levels show where short-term interactions are likely to occur.
Using such a map does not prescribe entries or exits. It simply organizes the chart so that conflicting signals are understood by their origin. A failed hourly breakout that occurs inside a weekly resistance zone carries different interpretive weight than the same pattern in the middle of a weekly range.
Common Misconceptions and Pitfalls
- Assuming higher timeframe equals guaranteed reversal: Higher timeframe importance increases the likelihood of a reaction, not the certainty of a reversal. Strong trends can and do absorb major levels.
- Treating levels as exact lines: Single-price lines are often misleading on higher timeframes. Zones better reflect how price negotiates at significant areas.
- Ignoring the close: Large intraday moves can reverse by the close. The higher timeframe record depends on where the bar closes, not on excursions that do not persist.
- Overfitting minor levels: Drawing many small intraday levels can obscure the larger context. If a lower timeframe level consistently fails when tested inside a higher timeframe zone, the higher timeframe is likely controlling behavior.
- Backfitting significance: Looking back and choosing only the levels that worked can create a biased view. An objective approach marks levels before they are tested again, so the interpretation is not influenced by hindsight.
Instrument and Market Structure Considerations
Markets differ in how sessions, liquidity, and volatility shape levels. Equities trade within set hours and often gap between days. Futures trade nearly around the clock with periodic pauses, which reduces the frequency of gaps but not of higher timeframe structure. Foreign exchange is continuous during the week, which means many levels form without session breaks and gaps, and round numbers can be prominent reference points. Timeframe importance persists across these markets, but its visible features, such as gaps or session highs and lows, vary with structure.
What to Look for When Assessing Levels Across Timeframes
- Clustering of touches: Multiple tests of a zone on higher timeframes increase its visibility. On lower timeframes, clustering near that zone suggests the market is negotiating the area.
- Wick behavior: Long wicks on daily or weekly bars at a known level indicate rejection within that timeframe. Similar wicks on five-minute bars can be routine noise.
- Range compression: Narrowing ranges as price enters a zone can signal that orders are balanced and that the market is waiting for more information before revaluing the area.
- Close location: Where the candle closes relative to the level matters for interpretation. A close inside a zone differs from a close beyond it.
A Second Practical Example: Conflict and Resolution
Assume a commodity future trades in a weekly range between 72 and 84 for several months. A strong daily rally carries price from 76 to 83.50 in three days. Intraday charts show momentum continuing to 84.20, pierces the weekly range high, and then spends several hours trading between 83.80 and 84.30. By the daily close, price settles back at 83.60, below the prior weekly high. The weekly candle later closes at 83.40. On a five-minute chart the push above 84.00 looked like a decisive breakout. Through the lens of the weekly chart, no weekly break occurred. The apparent contradiction is resolved by the timeframe importance of the 84 area. The higher timeframe level kept control of the narrative despite the lower timeframe push.
This example highlights how price can cross a boundary intraday without altering the higher timeframe structure. It underscores why analysts often annotate charts with the timeframe on which each level is defined and then interpret lower timeframe movement in that context.
Integrating Volume and Volatility Carefully
Volume and volatility are often used to evaluate reactions at levels. Higher volume near a weekly zone can indicate increased participation, while low volume can indicate exhaustion or indifference. Volatility expansion during tests of major levels is common as orders collide. These observations are descriptive only. They explain why some tests feature sharp rejection with long wicks and others grind through an area with several small candles.
Why Traders Pay Attention to Timeframe Importance
Market participants pay attention because this concept reduces interpretive noise. Without a hierarchy of levels, a five-minute rejection can appear meaningful in isolation, only to be contradicted by the daily close. With a clear hierarchy, such a rejection is recognized as a local event occurring inside a larger area that may or may not be resolved at the higher timeframe. This perspective helps explain the friction that often appears at the intersection of short-term momentum and long-term structure.
Putting It All Together
Timeframe importance of levels is a practical framework for reading price. Levels formed on higher timeframes are more widely observed, are supported by larger samples of data, and interact with how closes are recorded. On a chart, this appears as lower timeframe churn, hesitation, or repeated testing when price reaches a higher timeframe zone, and as clearer signals once a close occurs relative to that zone. Recognizing levels as zones and mapping them consistently across weekly, daily, and intraday charts produces a coherent picture of market structure without prescribing specific actions.
Key Takeaways
- Support and resistance from higher timeframes often carry greater interpretive weight because they aggregate more data and attract wider attention.
- On charts, higher timeframe levels appear as zones that organize lower timeframe behavior, including repeated tests, wicks, and consolidation.
- Intraday excursions beyond a higher timeframe level are common; the significance of a move often depends on the higher timeframe close relative to the zone.
- Confluence of levels across timeframes strengthens visibility, while conflicts between lower timeframe momentum and higher timeframe zones create complex price behavior.
- Treat higher timeframe levels as areas with tolerance rather than precise lines, and interpret lower timeframe moves within that broader context.