Introduction
Support and resistance zones are interpretive tools used to frame how prices behave over time. They are not fixed laws of motion. Instead, they are recurring areas on charts where market participation has previously intensified, often leading to hesitation, reversal, or acceleration in price. Understanding these zones helps a reader of charts connect visible price history to potential areas of future disagreement between buyers and sellers.
Because markets are continuous auctions, price oscillates as participants update expectations, manage inventory, and seek liquidity. Areas where many orders previously interacted can leave a visible footprint. Recognizing those footprints as zones, rather than single lines, better reflects the variability of order placement and the imperfect nature of real-time trading.
Defining Support and Resistance Zones
Support zone refers to a price area where buying interest has historically been sufficient to slow or halt a decline. When price approaches this area, participation often increases on the bid side, and order execution absorbs selling pressure more readily than in surrounding prices.
Resistance zone refers to a price area where selling interest has previously countered upward movement. When price rises into this area, offer-side liquidity and profit-taking tend to intensify, making further advance less straightforward.
The term zone is deliberate. Price does not react with mechanical precision at a single tick. Order placement is distributed across a range because participants have different objectives, time horizons, and tolerance for slippage. A zone acknowledges this dispersion by treating support or resistance as a band of prices rather than a razor-thin level.
Zones can be static or dynamic. Static zones derive from fixed price areas defined by prior highs, lows, gaps, or consolidation boundaries. Dynamic zones evolve along a slope, such as along a well-defined trendline or a rolling average price. Even dynamic references function as areas rather than infinitely thin lines, because trade occurs around them with some variability.
How Zones Appear on Charts
Support and resistance zones become visible through repeated interactions between price and an area of the chart. Common visual cues include the following:
- Clustered swing highs or lows. If several local highs occur near a similar price before price retreats, that region often reads as resistance. Analogously, several local lows forming near a similar level hint at support.
- Consolidation boundaries. When price oscillates within a range, the upper bound often functions as resistance and the lower bound as support. The width of the range provides a practical sense of zone thickness.
- Gaps. Unfilled price gaps sometimes behave as support or resistance. The edges of the gap, not only the midpoint, can act as reference prices for future sessions.
- Round numbers and price landmarks. Prices such as 100, 1000, or other psychologically salient values may gather orders. The effect varies by market and by the prevailing price regime.
- Volume at price distributions. A visible concentration of traded volume at a certain band on a volume profile can suggest a region where two-sided trade previously balanced. Such high-volume nodes can sometimes influence future behavior as price revisits them.
- Trendlines and moving averages as dynamic references. When multiple swing points align along an upward or downward slope, the connecting line can serve as a dynamic support or resistance area. Moreover, widely observed moving averages can operate as approximate reference zones rather than precise limits.
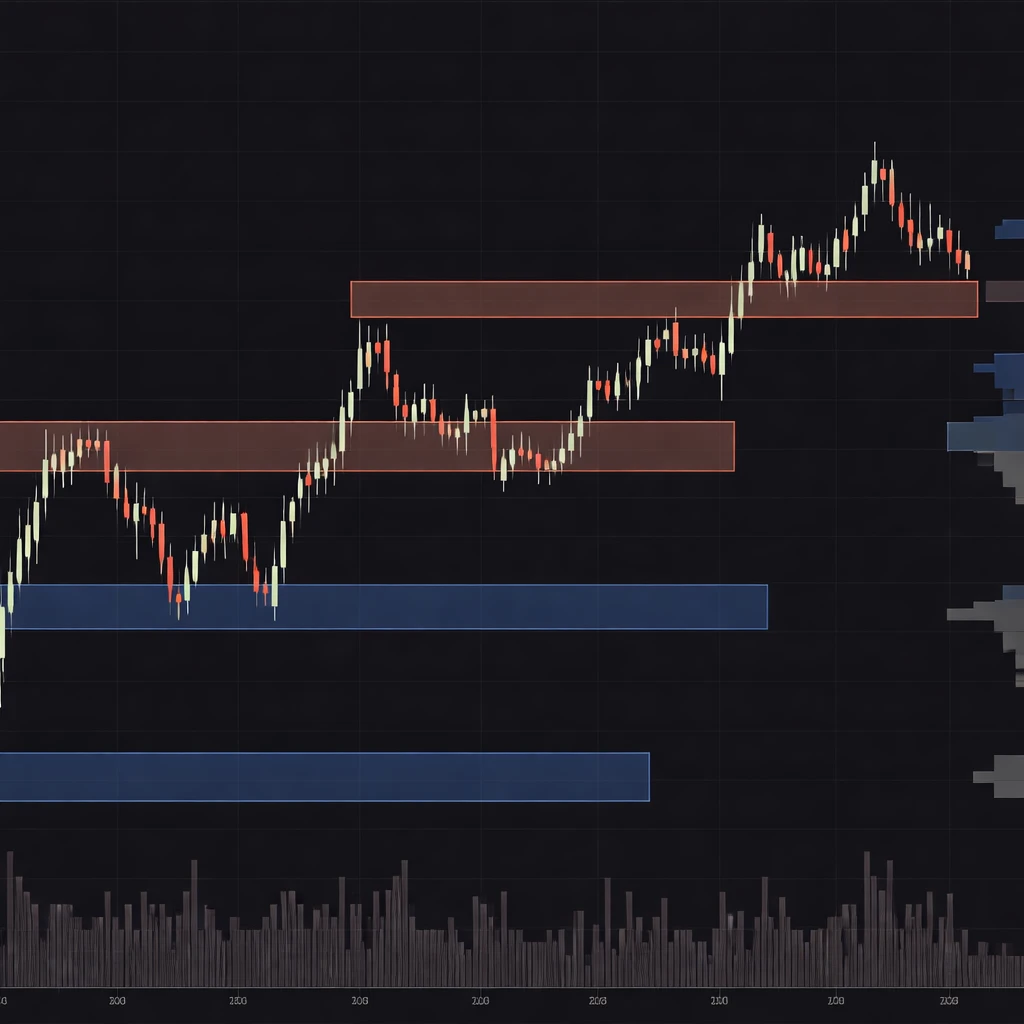
On candlestick charts, zones often span from the extremes of wicks to the bodies that clustered near turning points. Some practitioners draw two horizontal lines to mark a zone’s upper and lower bounds, then observe how price behaves when it enters that band.
Why Many Market Participants Monitor Zones
The appeal of support and resistance zones rests on several practical considerations related to how markets function:
- Order concentration and inventory. Market makers, funds, and individual participants leave footprints when they transact size. If significant order flow occurred around a price band, inventory management by those participants can influence future behavior when price returns.
- Shared reference points. Many participants review similar charts. Shared references can increase the likelihood that additional orders cluster at visible boundaries, which can, at times, amplify the observed effect.
- Liquidity and execution quality. Areas that previously attracted two-sided interest often provide better liquidity than surrounding prices. Participants who prioritize execution quality may prefer to trade near such zones, especially in larger size.
- Risk framing. For analysis and risk accounting, zones offer natural reference points for measuring distance, variability, and context. They help quantify how far price has traveled relative to areas of prior balance or conflict.
- Volatility dynamics. Price often slows as it approaches a well-observed zone. It can also accelerate after a decisive move through the area. These shifts in realized volatility make zones informative for interpreting the pace of price discovery.
From Line to Zone: Constructing Practical Zones
Turning isolated prices into zones is a matter of judgment informed by market behavior. The following practices describe how readers of charts commonly frame zones without implying any instruction to trade:
- Use swing structure. Identify recent swing highs and lows that occurred within a narrow vertical span. If three or more turning points cluster within a similar range, draw a band that covers the extremes of that cluster. Zone thickness reflects the spread among those extremes.
- Incorporate candle structure. Wicks often mark aggressive but short-lived pushes. Bodies reflect where the market found sufficient agreement to close. Many readers include both wick extremes and body clusters in the zone to account for overshoots and for areas of closing acceptance.
- Scale with volatility. Zone thickness can be adjusted based on average true range or a comparable measure of current realized volatility. In active markets, a wider band acknowledges that noise around the reference is larger.
- Respect multiple timeframes. Zones that are visible on higher timeframes tend to carry greater interpretive weight. Intraday fluctuations can add detail inside the larger band, but do not displace the broader context.
- Refine with volume at price. If volume profile data are available, focus on where traded volume concentrated within the candidate zone. The densest part of the distribution often marks the center of past agreement, while adjacent low-volume pockets can signify quicker transitions.
No single method is definitive. The goal is consistent framing rather than precision to the tick. Markets can and do trade through well-marked areas, but zones still help describe where and how the auction may change character.
Interpreting Price Behavior Near Zones
Price behavior around a zone often falls into a small set of recognizable patterns. These patterns are descriptive, not prescriptive:
- Pause or stall. As price enters a zone, order flow can temporarily balance. Candles may shrink, intraday swings may reduce, and volume can cluster without net progress.
- Rejection. Price probes into a band and quickly retreats, leaving wicks and little closing acceptance inside the zone. Rejection suggests that available liquidity displaced the incoming pressure.
- Penetration and acceptance. Price trades into and remains within or beyond the zone for a meaningful period. Closes inside the area, along with sustained two-sided trade, can indicate acceptance rather than a brief test.
- Overshoot. Strong momentum can carry price past the outer edge of a zone before any counterflow appears. Overshoots are common in fast markets and should not be read as unusual.
- Flip in role. After price moves decisively beyond a zone, subsequent returns to that area sometimes display a change in behavior. Prior resistance may behave like support, and vice versa, as inventory and expectations adjust.
Time is a critical dimension. A short dip into a zone during thin liquidity can have a different interpretive value than a multi-session build-up inside the band. Observing how long price spends at a location adds context to whether the market is rejecting or accepting that area.
Common Pitfalls and Misreadings
Because zones are easy to draw, they are also easy to overuse. Several pitfalls recur among chart readers:
- Seeing zones everywhere. Marking every swing as support or resistance clutters the chart and dilutes the significance of genuinely important areas. It helps to prioritize zones with multiple confirming features, such as clustering swings and visible volume at price.
- Anchoring to exact prices. Insisting that a level must be respected to the tick ignores market microstructure and intraday volatility. Markets regularly trade through widely watched areas, especially during news or rebalancing flows.
- Ignoring regime shifts. A zone defined during a low-volatility environment may not play the same role when volatility rises sharply. Event risk, liquidity conditions, and participation mix can alter the market’s response to prior references.
- Selective memory. It is easy to remember the times a zone appeared to hold and forget the times it did not. Chart reading improves when observations consider the full set of outcomes, not only the memorable ones.
- Over-interpreting single touches. A solitary bounce or turn does not always define a durable zone. Longevity and repeated interaction usually increase the interpretive value of a band.
Contextual Example: Reading a Hypothetical Chart
Consider an equity index future that rises from 3975 to 4120 over ten sessions. During the advance, three separate rally attempts stall between 4110 and 4120. Candles exhibit upper wicks near 4118, and closing prices cluster around 4112 to 4115 before each pullback. A reader of charts might mark a resistance zone spanning approximately 4110 to 4120, with the thickest part around 4114 to 4116 where several closes occurred.
Over the next week, price retreats to 4045, then returns to the 4110 to 4120 band. On approach, intraday ranges narrow, and cumulative volume increases at 4113 to 4117 without decisive progress. This behavior illustrates a pause at a known area. Later, an economic release increases volatility. Price surges to 4126, trades between 4122 and 4128 for several minutes, then settles above the prior band with a session close of 4130. Following days show that the market spends time between 4120 and 4135, suggesting acceptance above the former resistance band.
Two weeks later, a pullback takes price back to 4118 to 4120, the upper edge of the previously identified zone. During active hours, price dips to 4113, then rotates back above 4120 and stabilizes. Activity around the zone reflects two-sided trade that absorbs selling pressure. Observers would note the shift in role as the former resistance area now functions as a region of buying interest, although such flips are not guaranteed.
This narrative highlights how zones help describe the evolving conversation between buyers and sellers. The same area can act differently at different times, depending on how much inventory has changed hands, the pace of trade, and the broader context of news and liquidity.
Integrating Zones Within Broader Chart Context
Support and resistance zones gain meaning when placed within a broader analytical frame. Several dimensions are especially relevant:
- Trend context. A zone that aligns with the direction of an established trend will often be interpreted differently from a zone that runs counter to it. Observers look for whether interaction with the zone fits the ongoing structure of higher highs and higher lows or lower highs and lower lows.
- Volatility state. In quiet conditions, narrow zones can appear to contain price more often. In fast conditions, wider overshoots are common. Adapting zone thickness and expectations to volatility helps maintain realistic interpretation.
- Event calendar. Scheduled data releases, earnings, and rebalancing dates change liquidity conditions. Zones tested during thin or event-driven flows may behave differently from tests during routine sessions.
- Session structure. Cash opens, closes, and overnight trading have different characteristics. A zone tested in pre-market may not carry the same interpretive weight as a similar test during peak cash hours with deep liquidity.
- Cross-market signals. For some assets, related markets or sectors can add context. For example, currency moves, rates shifts, or sector breadth measures can influence how robust a zone interaction appears.
Durability and Evolution of Zones
Zones are not permanent. Their relevance tends to decay as market structure changes. Several factors govern durability:
- Time elapsed. The longer the time since significant trade occurred in a band, the less potent the reference may become, especially if market participants and positions have changed.
- Number of interactions. Repeated returns to a zone can either strengthen it by reinforcing its visibility or weaken it by consuming available liquidity. The outcome depends on how much inventory remains to transact.
- Volume and acceptance. If the market compresses and transacts heavy volume within a zone, the area can become a fair value region. Subsequent departures and returns may reflect that history of acceptance.
- Structural breaks. Major news, policy shifts, or macro regime changes can reset the trading landscape. Zones defined under prior conditions may lose relevance.
Frequently Asked Questions
How wide should a support or resistance zone be?
There is no universal width. Many analysts proportion zone thickness to recent volatility. A common practice is to cover the cluster of relevant swing highs or lows, including wick extremes and a margin that reflects typical intraday variation. In quiet markets, that margin can be small. In active markets, it should be larger to avoid over-interpreting minor penetrations.
Do zones work across markets and timeframes?
Zones can be identified in equities, futures, currencies, and other liquid instruments, and they appear on intraday, daily, and weekly charts. Reliability is not uniform. The clarity of zones depends on liquidity, noise, and participation patterns. Higher timeframes often provide cleaner signals of where significant prior activity occurred, while lower timeframes offer more detail.
Are support and resistance zones self-fulfilling?
Shared attention can influence outcomes. If many participants act near a visible area, their combined orders can help produce the behavior that charts seem to predict. At the same time, markets also move through well-known zones when larger flows or new information dominate. Any self-fulfilling aspect is conditional rather than absolute.
How long does a zone remain relevant?
Relevance declines as conditions change and as the market trades repeatedly through the area. A zone that has not been visited for months under a different volatility regime is less informative than a zone that was active in recent weeks with heavy participation. Observing whether price still reacts meaningfully at the band helps assess its current significance.
What if different methods define slightly different zones?
Disagreements are common. Price history can support multiple reasonable ways to draw a band, especially when swings are messy. Consistency in one’s method is more useful than chasing perfection. When in doubt, observe how price behaves across the entire candidate range and note where transactions concentrate.
Data and Tool Considerations
Chart-based interpretation benefits from accurate and context-rich data. Several practical points are worth noting:
- Data quality. Bad prints, missing ticks, or incorrect adjustments can distort perceived zones. Verify the integrity of the data feed, particularly around major events where data glitches are more common.
- Corporate actions and adjustments. For equities, splits and dividends alter historical prices. Using adjusted data is essential when analyzing longer histories so that zones reflect true economic levels rather than mechanical jumps.
- Session definitions. Decide whether to include pre-market and after-hours data. Zones defined in extended hours can differ from those defined in regular trading hours where liquidity is deeper.
- Chart type. Time-based bars, volume bars, and range bars emphasize different aspects of price behavior. A volume-based chart, for example, can highlight where actual transactions concentrated, which may refine zone placement.
- Volume at price availability. Not all platforms provide accurate volume-by-price data, especially for markets without centralized reporting. When available, it can improve understanding of where significant two-sided trade took place.
Advanced Nuances in Zone Interpretation
Beyond basic identification, a few nuances can deepen interpretation without prescribing action:
- Microstructure and liquidity layers. Order books are fragmented across venues. Quotes at neighboring prices can evaporate or replenish as conditions change. A zone that looks thick on a historical chart may be thin intraday, which can explain abrupt penetrations that later reverse.
- Time-of-day effects. Open and close periods often display both high liquidity and high volatility. Interactions with zones during those windows can look very different from midday tests.
- Asymmetry of response. The same zone can see sharp rejection in one direction and sluggish acceptance in the other, depending on who needs to transact. For example, a zone may repel price on the way up due to concentrated selling, yet later allow price to drift through on the way down if sellers are less urgent.
- Sequence matters. The order in which zones are tested can influence later behavior. A market that fails to reach an upper resistance band before rolling over may indicate waning enthusiasm at intermediate levels, even if the upper zone remains technically intact.
- Confluence without overfitting. Many readers watch for different references to overlap within a similar band, such as a prior high, a gap edge, and a volume node. Confluence can increase interpretive interest but should not lead to forced agreement where it does not exist.
Practical Chart-Based Illustration
Imagine a liquid currency pair trading between 1.0800 and 1.1000 for several weeks. Price repeatedly taps 1.0990 to 1.1000 and retreats, while dips to 1.0810 to 1.0830 attract buyers. A volume profile of the period shows heavy trade around 1.0915 to 1.0930. When price breaks above 1.1000 during a high-liquidity session, the next days reveal two different behaviors. First, an early rally stalls at 1.1060 to 1.1070, establishing a fresh resistance band. Second, a pullback tests 1.0995 to 1.1005 and finds two-sided trade. Over time the market spends significant hours above 1.1000, indicating acceptance of that shift.
Later, a policy headline produces a spike down to 1.0985 that is quickly absorbed. The wick extends into the prior band, yet the session closes back above 1.1010. The wick and close differential illustrates why zones are broader than single prints and why closing acceptance can matter when interpreting tests.
This narrative shows how prior consolidation, round numbers, and volume at price interact to create identifiable support and resistance zones that evolve as new information arrives.
What Zones Do Not Provide
Support and resistance zones are not predictive of exact turning points. They do not specify future outcomes or optimal decisions. They do not eliminate uncertainty. Their role is descriptive. Zones provide a framework for understanding where price has met significant participation before, which can help a reader interpret current price action with reference to observable history.
Markets can and will move through highly visible zones. News, order imbalances, and structural flows can overwhelm local liquidity. The usefulness of zones lies in their ability to organize information, not in any guarantee of reaction.
Key Takeaways
- Support and resistance are best framed as zones rather than single prices, reflecting the dispersion of real orders.
- Zones become visible where price has repeatedly interacted, such as clustered swing points, consolidation bounds, gaps, and volume-heavy bands.
- Market participants monitor zones because they concentrate liquidity, create shared references, and influence volatility around tests.
- Interpreting behavior near zones involves observing pauses, rejections, acceptance, and role flips, with attention to time and volatility.
- Zones are descriptive context, not predictive signals. Their relevance evolves with market conditions, participation, and event risk.