Range behavior is one of the most common states in financial markets. Prices often oscillate between two horizontal areas for a period before transitioning to a different state. The lower boundary of the range is often described as support. The upper boundary is often described as resistance. Within a range, these boundaries operate less as exact points and more as zones where the balance between buying and selling pressures shifts. Understanding how support and resistance function inside a range helps interpret whether the market is accepting value at certain prices or rejecting it.
Defining Support and Resistance in Ranges
Support in a range is a price area where declines stall and buyer interest tends to absorb selling. When price approaches this area, the auction slows, prints longer lower wicks, or sees a rise in traded volume as bids meet offers. Resistance is a price area where advances stall and seller interest absorbs buying. These zones are typically horizontal and are identified by repeated turning points and clusters of price interaction.
It is useful to distinguish range support and resistance from the same concepts in trending markets. In a trend, support and resistance often slope with the trend and can be represented by moving averages or trendlines. In a range, they are more often flat bands. The flatness signals that the market has located a temporary valuation bracket. Participants trade back and forth within that bracket until new information or order flow is sufficient to shift the bracket to a new level.
These boundaries are not precise ticks. They are best thought of as areas of heightened two-sided interest. The market may probe above or below by small amounts, either to test for additional liquidity or because different participants reference slightly different price anchors such as prior intraday highs, round numbers, or the previous week’s extremes.
How Support and Resistance in Ranges Appear on Charts
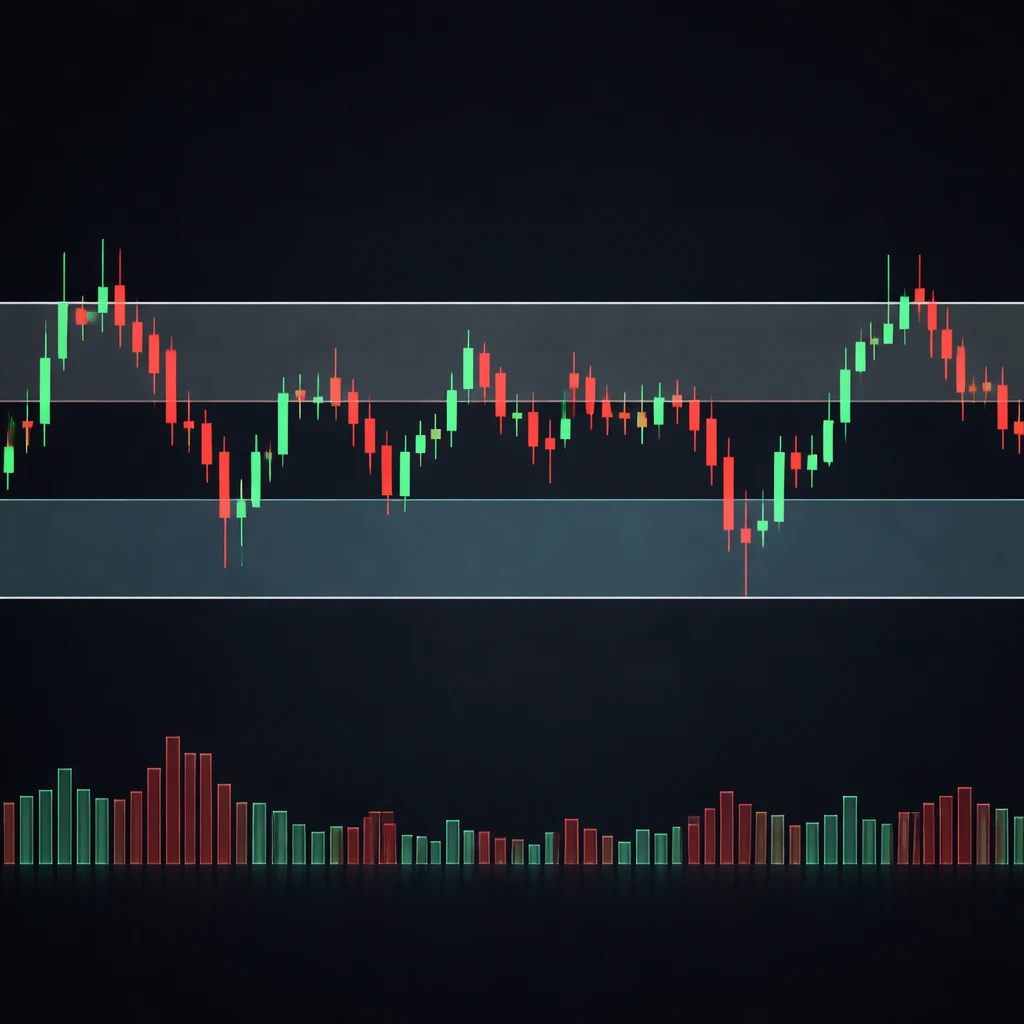
On a chart, a range often appears as a horizontal rectangle containing most of the recent bars. The top of the rectangle aligns with repeated swing highs, and the bottom aligns with repeated swing lows. Several visual cues help identify the boundaries:
- Multiple reversals near similar prices, often with overlapping closes.
- Wicks that extend into the boundary area and then reverse, indicating probing and rejection.
- Compression of candles in the middle of the range, with wider candles as price approaches the edges.
- Volume that clusters near the edges if transactions increase during tests, or that clusters in the middle if the market defines a fair value area.
Many chartists mark these zones with shaded bands rather than single lines. A band acknowledges that market memory is diffuse. Different participants remember slightly different pivot prices. Shading also prevents over-precision in interpretation. The band’s thickness can reflect observed variability in where rejections have occurred.
Timeframe influences visibility. On a daily chart, a range might span several weeks between two widely separated prices. On a 15-minute chart, the same instrument can display much smaller intraday ranges nested within the larger daily range. The higher timeframe range tends to exert influence, while lower timeframe ranges express intraday negotiation within that larger context.
Why Market Participants Watch Range Boundaries
Support and resistance in ranges are watched because they summarize where and how the market has negotiated value. The edges represent prices that the market has repeatedly tested and declined to accept for long. They serve as reference points for interpreting incoming information about supply and demand. Several reasons stand out:
- Market memory. Prior turning points are observed by many participants, including discretionary traders and algorithms. The repeated reference makes the boundaries self-reinforcing in the short term.
- Liquidity concentration. Stop orders and resting limit orders gravitate toward obvious highs and lows. The edges therefore attract liquidity, which is relevant for understanding why price may accelerate into the boundary and then slow or reverse once that liquidity is engaged.
- Acceptance and rejection. How price behaves at the edges helps interpret whether the market is accepting new value beyond the boundary or rejecting it and reverting to the middle of the range.
- Information flow. Significant news can arrive while a market is in a range. Watching the edges helps evaluate whether new information changes the prior balance of supply and demand.
These are interpretive uses of support and resistance. They do not prescribe specific trades. They provide context for judging whether observed price action aligns with a continued range or a transition to a different regime.
Interpreting Price Behavior Near the Edges
Each test of support or resistance offers information. That information is embedded in the path price takes into the boundary, the structure of candles at the edge, and what follows afterward. Several recurring behaviors are informative:
- Approach speed and structure. A steady, grinding approach may reflect balanced participation, while a sharp approach often reflects urgency or a liquidity-seeking move. Urgency into a level sometimes exhausts as the opposing side steps in at the boundary.
- Wicks and closes. Long wicks into a boundary that close back inside the range suggest rejection. Bodies that close through the boundary suggest acceptance. A single close is not definitive, but clusters of closes outside the boundary have interpretive weight.
- Overshoots and failed moves. Price often pushes slightly beyond support or resistance. This can be a liquidity sweep, drawing out stop orders before reverting. A brief overshoot that quickly returns inside the range indicates the market did not find acceptance at the new prices.
- Multiple tests. Repeated tests can cut both ways. On one hand, each defense confirms the boundary’s relevance. On the other, repeated harvesting of liquidity may thin the opposing side’s interest, making eventual acceptance more likely. The context and evolving volume help discriminate between these possibilities.
These behaviors are best evaluated together rather than in isolation. For example, an overshoot followed by a strong close back inside and declining follow-through in the direction of the overshoot tells a different story than an overshoot accompanied by expanding volume and multiple closes beyond the boundary.
Volume, Volatility, and Time Considerations
Volume clustering and participation
Volume often increases at range edges as resting orders are triggered and new orders engage. If the market meets that volume and still closes back inside the range, the rejection carries more weight because it shows that significant opposing interest absorbed the push. Conversely, a light-volume poke through a boundary can be ambiguous. It may indicate a lack of participation rather than true acceptance at new prices.
Volume profile tools can help visualize where transactions cluster. A prominent high-volume node in the middle of the range suggests a fair value area where both sides are comfortable transacting. Low-volume areas near the edges suggest that those prices have not been accepted for long, which aligns with the support and resistance interpretation.
Volatility contraction and expansion
Ranges often coincide with volatility contraction. Daily true range narrows, and intraday swings become smaller. When price nears the boundary during a contraction, the reaction can be muted at first. Expansion in volatility after multiple compressions often accompanies more decisive tests. Interpreting the change in volatility when price reaches the edge helps judge whether the market is prepared to accept prices beyond the boundary.
Time at price and duration
The amount of time spent within the range matters. A short, sharp range can be a pause in a larger directional move. A long, well-established range can reflect a sustained balance of opinions among market participants. The longer the market trades within a bracket, the more participants anchor to the bracket’s edges. That anchoring intensifies the interpretive significance of subsequent tests.
Practical Chart-Based Examples
Example 1: Daily consolidation in an equity
Consider a stock that rallies from 42 to 52 over three weeks, then spends the next 15 sessions oscillating between 48 and 52. The first few tests of 52 print upper wicks that fail to close above 52. Volume spikes during these tests, indicating engagement from sellers. On the other side, dips toward 48 show lower wicks and frequent closes near 49, where volume is again elevated. The middle of the range, near 50, attracts more trading and shorter candles, indicating agreement on value inside the bracket.
As the range persists, the market conducts several types of tests. On day 6 of the range, price opens near 51.80, pushes to 52.10 in the first hour, then reverses and closes at 50.90. This behavior indicates an overshoot of resistance followed by rejection. The next day, a morning selloff reaches 48.20, tags prior lows, and then reverses to close at 49.60. Each boundary shows that opposing interest remains active at the edges, while the bulk of trading clusters in the middle.
On day 12, a smaller candle climbs into 52, closes at 52.05, and is followed by a session that opens at 52.10 and trades between 51.70 and 52.30 before closing at 52.15. The range has its first back-to-back closes marginally above the upper boundary. The move is not decisive in distance, but it does represent a shift in acceptance. Chart readers would note that such clusters of closes can indicate a change in balance. Whether the change persists or reverts depends on subsequent participation and whether the market can transact meaningfully at the new prices.
Example 2: Intraday currency range
Imagine a major currency pair during the New York session that trades between 1.1030 and 1.1060 for four hours. The first approach to 1.1060 shows a swift uptick on a data release, followed by a long upper wick and a return to 1.1045. Later approaches slow down, and the candles compress near 1.1055 to 1.1060. Volume peaks during the first test and diminishes on subsequent tests. At the bottom of the range, several tests of 1.1030 print lower wicks and closes back above 1.1035.
Near the session end, price slips to 1.1027, prints a short hammer-style candle, and reenters the range within minutes. The brief break indicates that stops below the low were triggered, but the market did not accept lower prices. Such behavior illustrates how range edges can serve as liquidity pools. Price explores slightly beyond the boundary to uncover resting orders. If that exploration does not find new acceptance, it rotates back toward the interior of the range.
Both examples emphasize observation rather than prediction. The critical point is how price behaves when it interacts with support and resistance inside the range. Wicks, closes, and the pace of movement provide evidence about acceptance, rejection, and the presence of asymmetries in order flow.
Drawing and Maintaining Levels
Marking support and resistance within ranges benefits from a consistent, conservative method. Many chart readers use the following principles:
- Anchor to repeated swing highs and lows, not to outlier spikes that were instantly reversed.
- Prefer zones to single lines. A zone can encompass the spread of several recent turning points.
- Adapt zones when new information arrives. If multiple closes occur beyond a prior boundary and the market subsequently trades around the new prices, the previous zone may no longer be relevant.
- Note round numbers and prior session extremes, which often coincide with range edges due to behavioral anchors and order placement patterns.
A measured approach to drawing levels helps prevent overfitting. The goal is to represent consensus reference points, not to force exact alignment with every wick or intrabar fluctuation. A reasonable zone width can be guided by recent average true range or by the standard deviation of closing prices within the range, acknowledging the instrument’s volatility.
Common Pitfalls
Interpreting support and resistance in ranges is straightforward in principle but has several common pitfalls:
- Over-precision. Treating boundaries as single ticks leads to misinterpretation of normal probes. Small overshoots are common and, by themselves, do not imply that a range has ended.
- Ignoring higher timeframes. A clean range on an intraday chart may sit within a strong daily trend. The higher timeframe context influences how the range behaves and how often tests of the edges occur.
- Hindsight labeling. Ranges appear obvious after the fact. During formation, swings can be irregular. Labeling levels only after perfect touches risks survivorship bias and reduces the educational value of the exercise.
- Confusing low activity with strong support or resistance. A quiet reaction at an edge can reflect a lack of participation rather than meaningful defense. Volume and follow-through help separate the two.
- Overreliance on a single indicator. Price, volume, and time together provide the most complete picture. A single tool rarely captures the whole state of the auction.
Relation to Other Technical Concepts
Support and resistance in ranges connects naturally with several other concepts:
- Value areas and profiles. Volume profile methods emphasize where transactions accumulate. The middle of a range often aligns with a high-volume node. The edges often sit near low-volume troughs, reflecting less acceptance.
- Market microstructure. At the edges of a range, order books can thin and then refill as liquidity providers adjust quotes. Short-term volatility can increase as price explores for counterparties. The dynamics of stop and limit order placement near obvious highs and lows contribute to overshoots.
- Behavioral anchors. Round numbers, prior highs and lows, and widely watched moving averages can coincide with range edges, increasing their salience through collective attention.
- Regime shifts. A market may alternate between trending and ranging conditions. Recognizing when price is in a range helps avoid conflating behaviors that belong to different regimes.
Concluding Perspective
Support and resistance in ranges provide a simple, powerful framework for reading market behavior. The edges of a range summarize where the auction has repeatedly found enough opposing interest to stall. Watching how price interacts with these boundaries gives insight into acceptance, rejection, liquidity, and the evolving balance between buyers and sellers. The most informative evidence lies in the combination of approach speed, wicks and closes at the boundary, the presence or absence of volume, and the persistence of any excursion beyond the range.
Interpreting these features does not require prediction. It requires careful observation and a willingness to update one’s understanding as new information arrives. The range itself is a description of the current consensus. The boundaries are reference points against which that consensus can be evaluated. Whether the market continues to oscillate within the bracket or migrates to a new bracket, the same principles of support and resistance help decode what price is communicating about the state of supply and demand.
Key Takeaways
- Support and resistance in ranges are horizontal zones where the market repeatedly rejects further movement, not precise single-price points.
- Behavior at the edges, including approach speed, wicks, closes, and volume, provides evidence about acceptance or rejection.
- Liquidity concentrates near obvious highs and lows, which explains overshoots and brief breaks that quickly revert.
- Timeframe context, volatility conditions, and the distribution of volume all influence the interpretive weight of each boundary test.
- Drawing conservative zones, avoiding over-precision, and integrating price, volume, and time helps maintain an objective read of range behavior.