Support and resistance are among the most widely referenced ideas in technical analysis. Support is commonly described as a price area where buying interest has tended to absorb selling pressure, while resistance is an area where selling interest has tended to meet and offset buying pressure. These notions anchor how many participants describe market behavior. Yet the same popularity creates a risk of overconfidence. The concept has clear limitations that stem from market dynamics, observer subjectivity, data issues, and shifts in volatility and liquidity. Understanding these limitations helps interpret chart patterns with a more realistic sense of uncertainty.
What “Limitations” Means in the Context of Support and Resistance
The limitations of support and resistance refer to the boundaries of their explanatory power and the conditions under which these levels fail to guide interpretation. A support or resistance level is not a law of motion. It is an observed regularity that can change as participants adjust orders, as new information arrives, and as volatility regimes evolve. The same level that appeared to hold repeatedly can be overrun in one session, or ignored entirely if a gap opens through it. Additionally, most levels function as zones rather than single prices, which complicates the definition of success or failure.
Three sources of limitation are especially important. First, markets are non-stationary. Relationships that held in one period might not hold in another. Second, the identification of levels is partly subjective. Two skilled chart readers can anchor levels differently, particularly across timeframes. Third, the microstructure of liquidity and order placement introduces noise around levels, including false breaks and mean-reverting whipsaws that blur the boundary between valid and failed levels.
How Support and Resistance Appear on Charts
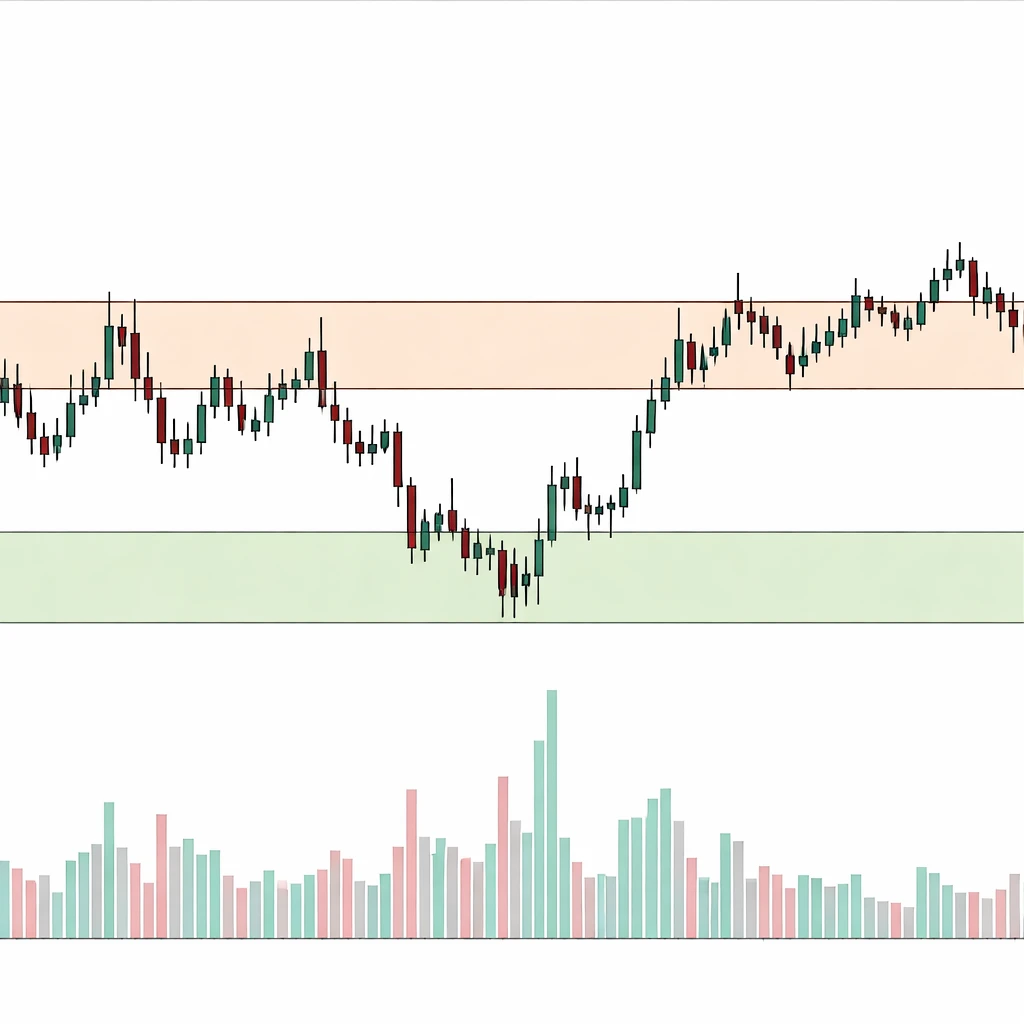
On price charts, support and resistance usually appear as horizontal zones derived from prior swing lows or highs, consolidation boundaries, or areas with heavy volume traded near a particular range. The visual hallmark is repeated interaction between price and a roughly similar price region, accompanied by slowing momentum, clusters of wicks, or short-term reversals. However, this appearance masks the complexity underneath. The following features are common in real charts:
- Zones, not lines. Price rarely turns at a single exact number. Interaction unfolds across a band, which can be several ticks or several percent wide depending on the asset and volatility.
- Wicks and false breaks. Candlestick wicks often pierce beyond a level and reverse. These overshoots can reflect stop runs or attempts to discover liquidity beyond obvious reference points.
- Gaps and jumps. News or order imbalances may produce gaps that skip over levels entirely, leaving no intrabar interaction with the zone.
- Timeframe dependence. A level visible on a weekly chart may not be discernible intraday, and vice versa. Each timeframe highlights different interactions.
- Volatility conditioning. The width and clarity of zones expand and contract with volatility. In quiet regimes, levels look precise. In turbulent regimes, they look diffuse.
These patterns create the impression of structure, but that structure is probabilistic. The same wick that signals rejection one day may be followed by continuation on another, depending on who needs liquidity and when.
Why Market Participants Pay Attention
Support and resistance levels function as reference points that concentrate expectations. Many participants monitor them because they are visible markers of where the market previously balanced supply and demand. They also help organize discussion about risk and uncertainty. When a price approaches a familiar level, the market’s collective memory becomes active, and liquidity often increases. Levels can influence quote placement, order size, and the pacing of executions. In this way, support and resistance shape market behavior even when they fail, because the approach to a level and the immediate aftermath often exhibit distinctive patterns of order flow and volatility.
Recognition of these reference points aids interpretation. A rapid failure through a well-observed level conveys different information than a slight intrabar breach followed by stabilizing price action. The attention itself is part of the mechanism: clustered orders around a level can produce a pause, an overshoot, or a sharp acceleration, depending on how those orders are matched and exhausted.
Core Limitations of Support and Resistance
1. Non-stationarity and Regime Change
Markets do not draw from a fixed distribution. Macro conditions, policy, and participation change over time. A level that mattered during a low-volatility expansion may lose relevance in a high-volatility contraction. Structural shifts, such as index rebalances, major product launches, or regulatory changes, can alter how price interacts with previously respected zones. As regimes change, the historical evidence that underpins a level becomes less informative.
2. Subjectivity in Level Definition
There is no universal rule for anchoring a level. Some chart readers use intraday extremes, others use closing prices. Some prefer bodies of candles over wicks. Some work from round numbers, volume profile features, or prior gaps. On logarithmic charts the vertical distance between levels differs from linear charts. This subjectivity means that two analysts can mark different levels on the same instrument and both appear justified. If the underlying identification is variable, so is any conclusion about whether a level held or broke.
3. Zones, Tolerance, and Measurement Error
Because levels are zones, statements like “support held” require a tolerance threshold. How far beyond the line is still consistent with the idea of support? The answer depends on volatility, tick size, and execution frictions. In higher-volatility periods, acceptable overshoots are wider. Without a clear way to quantify tolerance, assessments of success or failure risk hindsight bias.
4. Microstructure and Liquidity Effects
Order books often contain clusters of stops and resting orders around obvious levels. Liquidity providers may probe beyond a level to trigger these orders and access better liquidity. The result is a pattern of false breaks, thin prints, and quick reversals that makes clean interpretation difficult. When liquidity is fragmented across venues or when hidden orders dominate, the local picture on a single chart can misrepresent the true liquidity landscape. This microstructure noise can repeatedly confound the expectation that levels should cleanly hold or fail.
5. Volatility Regime and Range Context
The amplitude of price movement influences how levels perform. In compressed ranges, even modest levels can produce noticeable reactions. In expanded ranges, the same levels are swallowed by noise. Large average true ranges, frequent gaps, and news-driven bursts diminish the interpretive clarity of any single zone. In practice, the reliability of a level is conditional on the surrounding volatility environment.
6. Event Risk and Information Shocks
Economic releases, earnings, and geopolitical events can reprice assets faster than the typical auction process near a level. A sudden information shock can skip through support or resistance without meaningful trading at the supposed zone. In such cases, the level provides limited interpretive value because the price path is discontinuous.
7. Reflexivity: Self-Fulfilling and Self-Defeating Dynamics
Awareness of a level can attract orders that create a bounce or stall, which looks like validation. The same awareness can also create vulnerability. If many participants place stops just beyond a level, a small push through it can trigger a cascade that exaggerates the move in the opposite direction. The level then fails not because it lacked historical significance, but because its very visibility altered order placement.
8. Data Quality and Chart Construction
Charting choices influence perceived levels. Adjustments for dividends or splits, the inclusion or exclusion of pre-market and after-hours sessions, and the aggregation of ticks into candles all affect where a level appears. On thinly traded instruments, prints can be sporadic, creating misleading extremes. Any interpretation that relies on a precise price needs to account for these construction choices.
9. Cross-Asset Influences
Support and resistance in one market may be overruled by developments in another. Currency moves can change the valuation of exporters. Yield shifts can affect equity duration. Credit spreads can reset risk appetite. A level in the focal chart might fail simply because a related market moved decisively and re-anchored expectations.
How Limitations Present Themselves on Charts
Although every chart is unique, certain recurring visual motifs reveal the limitations of support and resistance:
- Multiple narrow pierces of a level with quick reversion. This often indicates two-sided liquidity hunting rather than a definitive hold or break. The level functions as a negotiation zone rather than a barrier.
- Gradual compression into a level followed by a sharp move through it. Price may print higher lows into a flat resistance or lower highs into a flat support. The eventual break can be abrupt, but it is not proof of a new regime by itself. It may simply exhaust local orders.
- Gaps that skip the zone. Overnight or event-driven movement jumps across a level, leaving no intrabar trades in the area. The chart shows a clean bypass rather than an interaction, which limits any inference about the level’s strength.
- Divergent behavior across timeframes. An intraday chart might show repeated failures at a price that the daily chart barely acknowledges. This divergence is a reminder that levels are scale-dependent.
- Volume clustering away from the line. Sometimes the heaviest trading occurs just above or below the drawn level, not at it, because final execution and absorption take place where liquidity actually sits, not where the eye draws a boundary.
Practical Chart-Based Contexts and Examples
Example 1: Range With Repeated Tests and a Fast Break
Consider a liquid equity that trades between 98 and 102 over several weeks. The area near 102 serves as an apparent resistance. Intraday charts show several approaches that stall, with upper wicks that pierce 102.10 and reverse. Volume is modest during the tests and increases on pullbacks. Later, a scheduled data release arrives. The open prints 102.80 on a gap and trades to 104 within minutes, with heavy volume. On the daily chart, the candle body closes far above the prior resistance band, yet there is no visible interaction at 102 on the breakout day.
This sequence shows multiple limitations. The resistance was a zone, not a line. The prior tests may have consumed resting sell orders, but the information shock repriced the asset in a way that skipped the zone entirely. Interpreting the earlier rejections as proof of durable resistance would overstate what the pattern could support. The gap illustrates that levels are conditional on the path of prices, not only on their location.
Example 2: Trend Context With a Revisited Level That Fails
Imagine a futures contract rallying from 50 to 65, pauses into a consolidation, and then extends to 70. Later it pulls back to the 65 area, where prior resistance had been observed. Some participants might describe 65 as potential support on the retest. At first contact, price stabilizes intraday, with shallow wicks and average volume. Over the next week, volatility expands. Price oscillates in a wider band and eventually closes below 65 by a meaningful margin during a session with above-average range.
Here, the notion that resistance turns into support meets its limits. The initial stabilization was contingent on a quieter volatility regime. When volatility expanded, the prior interactions lost explanatory power. The failure below 65 does not negate that the level previously mattered; it simply shows that the market’s conditions changed. Any interpretation must reflect the role of volatility in shaping how levels behave.
Example 3: Intraday Sweep and Reversion Around a Prior High
On a five-minute chart, yesterday’s high sits near 241. During the next session, price trades up to 241.20, triggers a visible burst of activity, then retreats to 240.60 before stabilizing. Later, it returns and trades through 241.30 and holds above that area into the close. The first visit looks like a failed breakout. The second visit looks like an acceptance above prior resistance. Both occurred within hours.
This illustrates microstructure noise. The initial move likely encountered stops and thin liquidity, which produced a quick rejection. The subsequent move found more stable liquidity and established acceptance. The presence of both behaviors around the same level underscores that support and resistance are negotiated through time, and that early signals can be contradicted quickly by new order flow.
Misconceptions That Arise From Overreliance on Levels
- Precision myth. Treating levels as exact numbers is misleading. Markets operate in bands, and overshoots are common.
- Touch count certainty. A frequently cited notion is that the more touches, the stronger the level. Repeated tests can also weaken a level by consuming available liquidity or by incentivizing participants to anticipate a break.
- Break equals inevitability. A print through a level does not guarantee sustained continuation or reversal. Follow-through depends on participation and liquidity, not solely on the breach.
- Universality across assets. What appears to work on a large-cap stock may behave differently on an illiquid small-cap or a currency pair, due to distinct volatility, tick size, and trading hours.
- Timeframe portability. Levels observed on one timeframe do not automatically govern behavior on another. Scale alters interpretation.
Measurement Challenges and the Risk of Bias
Attempting to quantify the reliability of support and resistance encounters several pitfalls:
Look-ahead bias. Analysts sometimes anchor levels using points that were not obvious at the time. Selecting a clean swing low retrospectively can overstate clarity.
Survivorship and selection bias. Charts that neatly respect levels are more likely to be remembered and shared. Messy examples are ignored, producing an availability bias.
Ambiguous scoring rules. Without predefined rules for what counts as a touch, a break, or a hold, the evaluation becomes subjective. Small changes in rules can swing results substantially.
Non-independence of observations. Multiple touches of the same level in a short period are not independent events. Treating them as independent inflates confidence in the pattern.
Interpreting Levels Within a Broader Context
While this discussion focuses on limitations, it is also important to situate support and resistance within a wider analytic frame. Price does not interact with levels in isolation. The time of day, proximity to scheduled events, cross-asset movements, and liquidity conditions all influence how a level behaves. Volume patterns and the distribution of trade within the day often matter for how a move develops after interacting with a level. Observing these contextual elements refines interpretation without assuming that a level alone determines the outcome.
In practice, many analysts annotate charts to distinguish between intrabar excursions and closing acceptance around a level. They may record how far price overshoots a zone during higher-volatility sessions compared with quieter sessions. Some also track whether volume accelerates or fades as price approaches a level. None of these observations guarantee what happens next. They simply acknowledge that the performance of a level is conditional on the environment.
Visual Clues That a Level’s Explanatory Power Is Weakening
Certain recurring signs suggest that the market’s respect for a level may be eroding or at least becoming less reliable as a guide to interpretation:
- Expanding intrabar ranges across the zone. Wider candles across a level indicate that uncertainty or disagreement is increasing, which reduces the clarity of the signal.
- Persistent grinding through the level. A slow, low-volatility drift across a level can indicate that there is no sharp imbalance, and that the level is being absorbed rather than defended.
- Shifts in where volume concentrates. If high volume migrates away from the level over successive interactions, the locus of negotiation may be moving.
- Failure of confluence. When other contextual elements, such as higher timeframe structure or related markets, diverge from what a level would imply, the level’s standalone relevance diminishes.
Implications for Reading Market Behavior
Recognizing the limitations of support and resistance reframes how chart patterns are read. Levels are best understood as evolving negotiation zones whose influence waxes and wanes with liquidity, volatility, and information flow. Interactions with these zones convey information about urgency and participation, but the same interaction can have different implications under different conditions. A test that holds during low volatility may fail abruptly during a higher-volatility phase. A clean break without volume may reverse, while a grind through the level may signal that market participants have little incentive to defend it.
Importantly, levels are part of a feedback loop. As more participants watch a level, their orders shape the very outcome they seek to anticipate. This feedback can stabilize prices temporarily or destabilize them if clustered stops are triggered. Interpreting price behavior near levels requires acknowledging that the crowd’s attention is both informative and destabilizing, depending on how the order flow is distributed.
Chart Study Practices That Highlight Limitations
Several study habits can make the limitations of support and resistance more visible to the analyst without implying any strategy:
- Record the width of observed zones and how that width changes with volatility.
- Differentiate intrabar excursions from session closes when assessing whether a level held or failed.
- Note the presence of gaps that bypass levels and how subsequent sessions interact with the skipped zone.
- Compare the behavior of a level across multiple timeframes to identify scale effects.
- Observe cross-asset movements during interactions with levels to understand broader drivers of price.
These practices do not convert support and resistance into certainties. They simply document the conditions under which levels carry more or less interpretive weight.
Putting Limitations Into Perspective
The persistence of support and resistance in market dialogue reflects their usefulness as a common language. That usefulness is compatible with frequent failure, ambiguous signals, and contradiction across timeframes. Clarity emerges not from assuming that levels are predictive, but from recognizing that they summarize recent negotiation and focus attention where new information is likely to reveal itself quickly. When price approaches a widely watched level, the next moments typically concentrate order flow and reveal the current balance of urgency among buyers and sellers. That revelation may affirm, negate, or ignore the level entirely.
Therefore, the value of understanding limitations is not to dismiss support and resistance. It is to anchor expectations around the reality that markets are adaptive systems with shifting participants and constraints. Levels provide signposts. The road conditions determine how vehicles move through them.
Key Takeaways
- Support and resistance are zones of prior negotiation, not precise barriers, and their meaning depends on volatility, liquidity, and information flow.
- Subjective identification, data construction choices, and timeframe differences limit the consistency of level-based interpretations.
- Microstructure effects, including stop clusters and liquidity probes, generate false breaks and whipsaws that complicate clean readings of levels.
- Event risk and cross-asset influences can override historical levels, producing gaps or moves that bypass expected interactions.
- Studying how levels behave across regimes and contexts improves interpretation, but no level by itself determines future price behavior.