Overview
Support and resistance are among the most enduring ideas in technical analysis. At their core, they describe areas where price has historically struggled to move beyond or has repeatedly found buying or selling interest. Within this broad concept, two categories are especially useful for interpreting market behavior: static levels that do not change once defined, and dynamic levels that evolve with time according to a rule or calculation. Understanding how each type functions, how they are observed on charts, and how they interact provides a clearer framework for reading price movement without resorting to prediction or prescriptive tactics.
This article defines static and dynamic levels, shows how they typically appear on charts, explains why many market participants monitor them, and provides practical chart-based context that helps you recognize the signals they provide about balance, trend, and volatility.
Defining Static Levels
Static levels are horizontal reference points that remain fixed after they are identified. They are often derived from historical prices or structural features of the market. Once marked, a static level does not move unless it is redefined by the analyst. Common examples include prior swing highs and lows, gaps, round numbers, and the high, low, or close from a previous session or week.
Static levels are sometimes drawn as thin lines, but in practice they behave like zones. The width of a zone reflects volatility, typical slippage, and the imprecision of crowd behavior. The idea is not that price will react at a single tick, but that a region of interest formed there previously. A static level can retain informational value long after it is first identified, because it encodes the memory of prior transactions, positions, and expectations.
Typical sources of static levels
- Prior swing highs and lows that capped advances or arrested declines
- Unfilled gaps on daily charts, especially gap openings that remain open for several sessions
- Round numbers where orders cluster, such as 100, 1000, or 1.2000 in currency pairs
- Previous session high, low, and close, which many participants monitor as reference prices
- Retracement or projection markers, such as Fibonacci levels and measured move targets, which once drawn do not change
Static levels are diagnostic. They help the analyst assess whether price is accepting or rejecting a previously established reference. Repeated interactions can either reinforce the level or weaken it if the market appears to absorb orders there over time.
Defining Dynamic Levels
Dynamic levels change as new data arrives. They are computed by a rule that includes time and price so the reference value itself evolves. Dynamic levels reflect the market’s moving consensus and can help the analyst observe shifts in trend, momentum, or balance.
Typical sources of dynamic levels
- Moving averages, including simple, exponential, and weighted versions
- Rolling channels such as Donchian channels that track highest highs and lowest lows over a window
- Volatility-based envelopes, including Bollinger Bands or Keltner-type channels
- Regressions and their confidence bands fitted over a sliding window
- Volume-weighted references such as a rolling or anchored VWAP that updates with each trade
- Trendlines drawn as price evolves, where each new swing can refine the slope and placement
Dynamic levels adapt to the data generating process. A rising moving average indicates that recent prices are, on average, higher than older ones. A tightening volatility envelope indicates that recent price dispersion has contracted. Because these references update with every bar, the market’s relationship to the level can change intraday or day to day without any redrawing by the analyst.
How the Concepts Appear on Charts
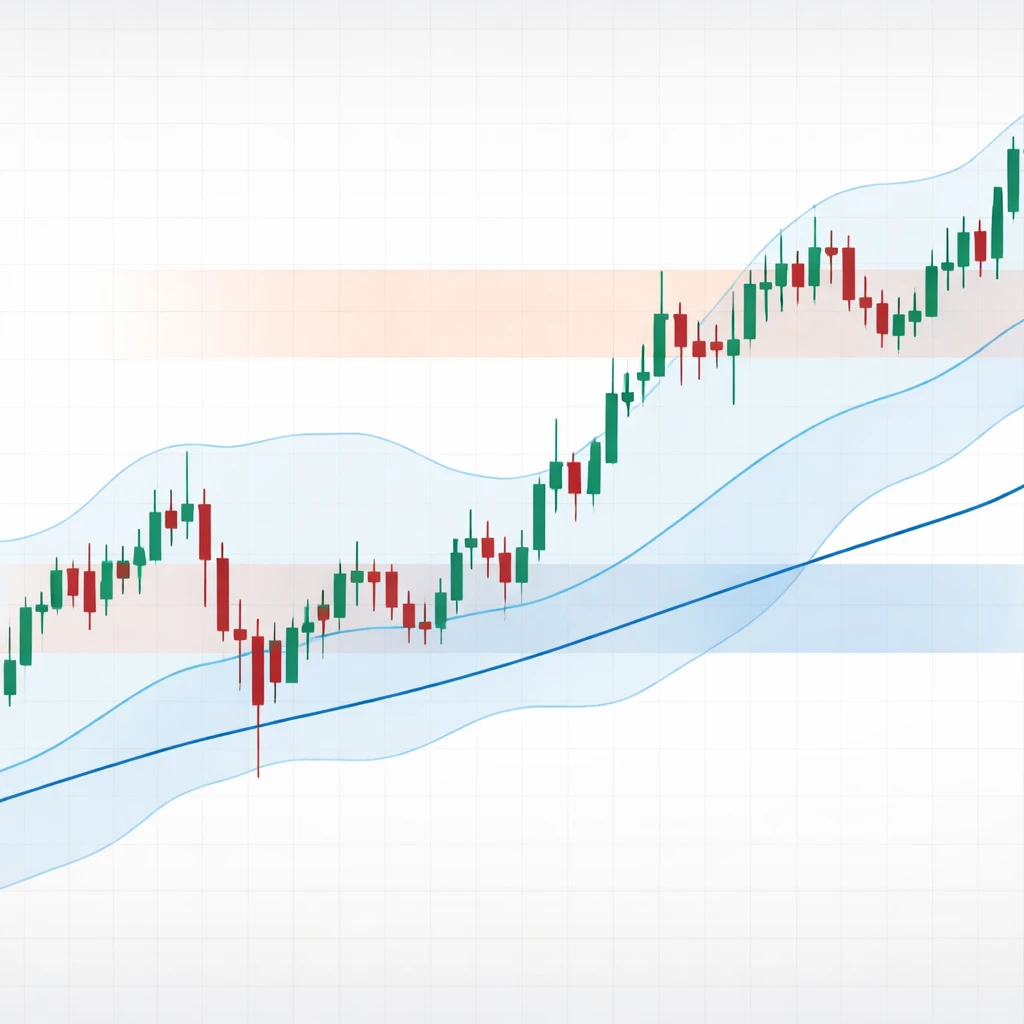
On the chart, static levels appear primarily as horizontal lines or shaded bands. They do not slope and do not re-calculate as time passes. Their visual impression is a fixed landmark that price approaches, touches, pierces, or leaves.
Dynamic levels appear as curves or sloped lines that follow price over time. Simple moving averages may curve gently. Trendlines have a slope determined by prior swing points. Channels shift and expand or contract as new highs and lows or new volatility readings are incorporated. They rarely sit still.
Two visual patterns are common and instructive:
- Price rotates around a dynamic reference while oscillating between static boundaries. In range conditions, a horizontal ceiling and floor may contain price, while a moving average weaves through the center acting as a gravity point.
- Price trends with a dynamic guide and periodically tests static landmarks. In advancing phases, a rising moving average or shifted channel may guide pullbacks while prior swing highs act as check points of acceptance or rejection.
Why Market Participants Monitor These Levels
The attention paid to support and resistance is often self-reinforcing. Levels become focal points for orders because many participants see them, and they see them because they are part of shared analytical practice. Beyond this reflexivity, there are concrete reasons why the two categories matter.
Information embedded in static levels
- Position memory. Price zones where many trades occurred can leave behind inventory. Later visits can encounter residual interest from traders aiming to exit, average, or hedge.
- Reference pricing. Certain fixed prices, such as a prior close, act as benchmarks for performance and risk measurement. Institutions often compare outcomes to these references, which can influence intraday flow.
- Order clustering. Round numbers and well-known prior peaks attract both discretionary and automated orders. This clustering can affect short-term liquidity and slippage.
Information embedded in dynamic levels
- Consensus and trend proxy. Moving averages summarize the recent distribution of prices. When price spends time above a rising average, the market is tolerating higher values relative to its own recent history.
- Balance and reversion markers. VWAP-type references are widely used to benchmark execution. Price oscillation around them can reflect mean-reverting forces tied to benchmark-aware flow.
- Regime and volatility cues. Dynamic channels expand and contract with dispersion. Tightening bands often coincide with lower realized volatility, while expansions coincide with higher dispersion.
In short, static levels encode historical landmarks while dynamic levels reflect current state variables. Observing both offers a more complete view of how value is being discovered and negotiated.
Practical Chart-Based Context
Consider a daily chart of a large-cap equity that has rallied for several months. The stock paused near a prior all-time high, which is a static level drawn as a horizontal line. At the same time, a 50-day simple moving average has been rising beneath price. After a brief consolidation, price pulled back toward the 50-day average and the vicinity of the prior high. On the chart, these two references sit close together. If price trades down into this area and then moves away, the analyst can read that interaction as a test of both a historical landmark and a dynamic guide. If instead price spends several days below both, the chart shows waning demand relative to its recent average and a potential change in the way participants value that prior peak.
As a second example, imagine an intraday futures chart with a rolling VWAP plotted from the session open and horizontal lines marking the previous session high and low. Early in the session, price spends time oscillating around VWAP, indicating a balance near the volume-weighted benchmark. Later, price pushes to test the prior session high. The prior high is static, but the relationship to VWAP is dynamic. Observing whether price accepts above the static level while staying above the dynamic benchmark can help the analyst judge whether the market is discovering higher value or simply stretching and reverting.
For a counter-example, consider a range-bound currency pair. The weekly chart shows two obvious static levels that have capped advances and declines for months. On the daily chart, a mid-length moving average whipsaws price repeatedly inside the range. Here the static levels provide the more stable landmarks, while the dynamic measure offers little directional information. This illustrates that the usefulness of a level depends on context, not on the tool itself.
Interpreting Common Interactions
Reading dynamic and static levels involves distinguishing a few recurring interactions. None of these interactions prescribe action on their own, but they help frame what the market is doing.
Test and rejection
Price approaches a static level or a dynamic line, trades into it, then moves away with increasing distance. The rejection may be swift on high activity or gradual over several bars. Rejections suggest that the level contained sufficient opposing interest to turn price back. On charts this shows up as wicks, outside bars, or sequences of bars away from the level.
Break and acceptance
Price trades through a level and then spends time or volume beyond it. If the market consolidates on the far side, the level can flip its character. A prior ceiling can become a reference for support, or vice versa. Acceptance often matters more than the initial break because it signals that new value has been located and tolerated by participants.
Absorption and weakening
Repeated tests that penetrate slightly deeper each time suggest that resting interest is being absorbed. Static levels can weaken if the market allocates time there without being repelled. Dynamic levels can flatten or change slope as price spends time on the opposite side, indicating a shift in recent average conditions.
Overshoot and mean reversion
Dynamic channels based on volatility often contain most price action in quiet conditions. When price overshoots an outer band, the next behavior to observe is whether it quickly returns inside the envelope or whether the band itself expands and follows price. Quick re-entry hints at transient dislocation. Band expansion hints at a regime change in volatility.
Confluence: When Dynamic and Static Levels Align
Confluence occurs when a dynamic reference and a static level occupy a similar price region. For instance, a rising moving average may intersect a prior breakout level, or a rolling VWAP may align with a round number. Confluence areas attract attention because they concentrate multiple analytical frames at one location.
On a chart, confluence is visible as an overlap or near-overlap of lines and zones. The practical value is interpretive. Reactions at confluence can appear more forceful or, when exceeded, can mark a meaningful shift in balance. Importantly, confluence does not guarantee a particular outcome. It signals a place where behavior is likely to be revealing. If price rejects at confluence, it suggests that multiple groups responded there. If price accepts beyond it, that acceptance is informative because several potential sources of resistance or support were negotiated.
Timeframes and the Hierarchy of Levels
Levels exist across timeframes and can conflict. A weekly static level may cap price, while a 15-minute dynamic average trends upward. In practice, many analysts create a hierarchy: higher-timeframe levels often frame the broader landscape, while lower-timeframe dynamics narrate the path inside that landscape.
Two considerations help organize this hierarchy:
- Persistence of influence. Higher-timeframe static levels tend to remain relevant longer than intraday landmarks. Their influence often crosses sessions because more capital and attention interact near them.
- Speed of information. Dynamic levels on lower timeframes react faster to new information. They describe the microstructure of the move, such as short bursts of momentum or mean reversion around execution benchmarks.
Aligning these views is educational. When a lower-timeframe dynamic level changes character precisely at a higher-timeframe static level, the chart offers a clear narrative about where shorter-term behavior intersects with longer-term reference points.
Common Dynamic Tools and Their Behavior
Several dynamic references have distinctive behavior. The following descriptions focus on interpretation rather than parameter selection or tactics.
Moving averages
A moving average is an arithmetic or weighted mean of recent prices over a chosen window. Simple averages treat all observations equally, while exponential averages assign larger weights to recent observations. On charts, moving averages smooth noise and reveal the general slope of recent price behavior. Price above a rising average indicates tolerance of higher prices relative to the recent window. Price crossing below a flattening average indicates changing recent conditions. Longer windows change slowly and emphasize persistence. Shorter windows respond quickly and emphasize sensitivity.
Rolling price channels
Donchian channels track the highest high and lowest low over a fixed lookback. They are especially clear in range and breakout analysis. When price hugs the upper boundary, recent highs are being repeatedly set. When price oscillates between boundaries, it indicates that supply and demand find balance inside the recent range. Channels expand during trend or high dispersion and contract during consolidation.
Volatility envelopes
Envelopes such as Bollinger Bands center around a moving average and add or subtract a multiple of recent standard deviation. These bands adapt both to direction and to volatility. Tight bands often accompany quiet conditions. Expanding bands tell you that dispersion is increasing. Price walking the band indicates persistence rather than immediate reversion. Quick return inside the band after a tag suggests that the excursion was not sustained.
VWAP and anchored VWAP
The volume-weighted average price accumulates price and volume to produce a benchmark that reflects the average price paid for the session or a defined period. Execution algorithms and performance measurement often relate to VWAP, so intraday price behavior around it can carry information about balance, liquidity provision, and benchmark-aware flow. Anchored VWAP fixes the start at an event such as an earnings gap, a major high, or the start of a quarter. From that anchor, the level evolves as trades occur. Interactions with anchored VWAP offer a lens on how the market has valued the asset since the selected event.
Trendlines and regressions
Trendlines connect swing points and therefore update as new swings print. Their slope expresses the pace of advance or decline. Linear regression lines fitted to a sliding window provide a statistically grounded counterpart, with residual bands that adapt to dispersion. Both serve as dynamic guides to the central path and its variability.
Static Levels in Detail
Static levels derive from history, so their interpretation often depends on why price stopped or accelerated at those landmarks in the first place. The chart alone may not reveal the cause, but the effect is visible.
Prior swing highs and lows
These are the most common static references. Peaks and troughs mark locations where the balance between buyers and sellers shifted. When price returns, analysts watch for signs of acceptance beyond the prior pivot or signs of rejection that keep price within the existing distribution.
Gaps
Price gaps on daily charts mark transitions where liquidity was scarce or new information revalued the asset between sessions. The edges of gaps often function as magnets or barriers. If a gap remains open, the upper and lower edges create a static zone that can attract future tests.
Round numbers and psychological thresholds
Order books frequently show clustering at integers or culturally salient thresholds. This clustering can create friction or acceleration when approached. On charts, these levels are easy to mark and often align with other references, creating confluence.
Previous session levels
The prior day’s high, low, and close serve as simple benchmarks for many participants. On intraday charts, these lines provide orientation for balance and expansion relative to the immediate past.
Contextual Reading Without Strategy Prescription
While some practitioners design specific tactics around levels, it is possible to use the information qualitatively without turning it into a rule set. Three context questions illustrate this approach:
- Where is price relative to key static landmarks. If price spends time above a prior ceiling, the market is tolerating values beyond that reference. If it cannot, the market is still respecting the earlier boundary.
- What is the slope and character of dynamic references. Rising, flat, or falling dynamics say something about recent distribution of prices. Steepening slopes often coincide with acceleration. Flattening slopes often coincide with transition.
- Are static and dynamic references aligned or conflicting. Alignment suggests that multiple perspectives agree. Conflict suggests a contested environment where neither side has firm control.
This form of reading does not tell you what to do. It clarifies what the market is doing and where that behavior is most informative.
Limits, Pitfalls, and Sources of Bias
Support and resistance are widely used, but there are important caveats when interpreting them.
- Lag in dynamic measures. Moving averages and VWAPs summarize past data and therefore lag. A rapid revaluation can leave these references far from current price, which reduces their immediate interpretive value.
- Subjectivity in drawing. Trendlines and zones can vary by analyst. Small changes in anchor points can change the slope or location of a dynamic guide. Being explicit about rules reduces subjectivity.
- Data quality and adjustments. Splits, dividends, contract rolls, and stale prints can distort levels. Adjusted data can move historical swing points. For futures, continuous series construction can alter what appears to be a static level across rolls.
- Overfitting and hindsight bias. It is easy to draw lines that fit the past perfectly. The true test is whether the level provided a clear reference in real time without knowledge of what followed.
- Regime change. Static levels can lose relevance after structural shifts, such as macro announcements or corporate events that re-anchor expectations. Dynamic levels adapt, but the adaptation can be slow relative to the speed of the change.
Combining Levels with Other Evidence
Many analysts contextualize levels with other information to strengthen interpretation. Volume at price histograms can show where trading concentrated near a static level. Breadth measures can indicate whether participation corroborates a break beyond a level. Volatility indicators can explain why a dynamic band suddenly expanded. None of these are required, but they help distinguish between a random touch and a meaningful negotiation of value.
Reading Examples Across Market Conditions
Trending environments
In a pronounced uptrend, a rising moving average or regression line often runs beneath price. Pullbacks toward it reveal whether buyers remain willing to pay higher prices than the recent mean. Static levels set by prior consolidation highs can serve as waypoints. When price approaches one of these, the following observations are instructive: how quickly price moves through, how much time it spends beyond, whether the dynamic guide remains rising, and whether dispersion expands or contracts afterward.
Range-bound environments
In a sideways market, horizontal ceilings and floors dominate. Dynamic references often chop back and forth with little interpretive value beyond confirming that the market lacks directional persistence. Watching for acceptance outside the static range, combined with expansion of a volatility envelope, can indicate a transition from balance to imbalance.
High-volatility environments
In turbulent conditions, dynamic channels widen and the distance between price and moving averages can become large. Static levels can be overshot more easily due to wider bars and faster swings. Here, time spent beyond a level becomes a more reliable filter than a one-bar break, because large ranges can produce many transient excursions that do not reflect true acceptance.
Implementation Notes for Chart Work
Analysts benefit from consistent rules for drawing and maintaining levels. Clarity reduces hindsight adjustment and keeps the interpretation honest.
- Define which swing highs and lows qualify as static references, and whether you mark them as single lines or zones.
- Specify data adjustments and sources so that levels are stable across sessions and platforms.
- Document the parameters of dynamic tools and avoid frequent tweaking. Observations become more meaningful when the reference is consistent over time.
- Record notable interactions as they happen. Screenshots and notes help track whether a level had informational value in real time.
How Levels Lose or Gain Relevance
Levels are not permanent. They evolve in importance as market behavior changes.
- Reinforcement through tests. A static level that repeatedly halts advances can become a well-known landmark. If many participants see it, reactions can grow stronger, at least until a decisive acceptance occurs.
- Erosion through time at level. When price lingers at a level without decisive movement away, it suggests absorption. The market incorporates that price into its accepted value area, which weakens the level’s defending power.
- Recalibration of dynamic references. A sustained move on one side of a moving average will pull the average toward price. When slope changes, the characteristic of the trend proxy changes as well.
A Conceptual Checklist for Reading a Chart
The following checklist keeps the focus on interpretation rather than action:
- Identify the most relevant static landmarks from the higher timeframe.
- Note the prevailing slope and position of key dynamic references on the working timeframe.
- Mark any areas of confluence where static and dynamic references cluster.
- Observe whether price rejects, accepts, or absorbs at those locations.
- Monitor changes in volatility that affect the width of dynamic channels and the effective thickness of static zones.
Used this way, the combination of dynamic and static levels provides a structured narrative about how value is migrating, whether the market is balanced or imbalanced, and how that balance is evolving through time.
Key Takeaways
- Static levels are fixed horizontal landmarks derived from history, while dynamic levels evolve through rules that incorporate time and price.
- Static references encode market memory and order clustering, whereas dynamic references summarize recent state, including trend and volatility.
- On charts, static levels appear as horizontal lines or zones and dynamic levels as sloped or curving guides that update with each bar.
- Confluence between static and dynamic references creates informative areas where market behavior often reveals acceptance, rejection, or absorption.
- Levels gain or lose relevance through repeated interaction, time spent at the level, and regime changes that alter how participants value the asset.