Introduction to Price Gaps
Price gaps are one of the most visible discontinuities in market charts. A gap appears when a new session or bar opens at a price that does not overlap the previous session's trading range, leaving a blank space between bars. Although gaps are easy to spot, the underlying causes are rooted in market microstructure, information flow, and liquidity. Understanding gaps helps frame price behavior in context, particularly around events that alter expectations or redistribute order flow.
This article defines price gaps precisely, shows how they appear on different chart types, explains why many market participants monitor them, and presents practical chart-based context. The goal is to build conceptual clarity so that gaps can be interpreted as part of broader price action analysis, not as stand-alone signals.
What Is a Price Gap
A price gap is a non-overlapping transition from one bar to the next. On a daily chart, a gap occurs when the current day's opening price is strictly above the prior day's high or strictly below the prior day's low. The space between the two bars represents prices that were not transacted during the transition from one session to the next.
Gaps are not limited to daily charts. They can occur on intraday timeframes as well, particularly during transitions between regular and extended trading sessions or following a halt. The key element is discontinuity. If there is no overlap between the ranges of two consecutive bars, a gap is present.
Session Mechanics and the Opening Auction
In many equity markets, the session begins with an opening auction. Orders queued overnight or during pre-market trading are matched at a single clearing price. If information that arrived outside regular hours caused significant changes in supply or demand, the auction may clear far from the prior close. The first print can be substantially higher or lower than the previous session's range, which creates a gap on the chart.
Futures markets often trade for a large portion of the 24-hour day, but even there, liquidity varies, and contract roll or thin overnight activity can produce discontinuities. Foreign exchange is close to continuous during the week, yet the weekend closure can yield gaps at the Sunday open.
How Gaps Display on Common Chart Types
On a candlestick chart, an upside gap appears as a candle whose real body and shadows sit entirely above the previous candle's high. A downside gap appears when the entire candle, including shadows, sits below the prior candle's low. On OHLC bars, the visual is similar. The essential feature is a visible blank space between the two bars.
Charting platforms that include extended-hours data may reduce the number of apparent gaps on intraday charts, since some trading did occur between sessions. On the same instrument, a daily chart can show a gap that is less obvious on a one-minute chart with pre-market data visible. Interpreting gaps therefore requires awareness of the data context and time aggregation.
Types of Gaps in Practice
Practitioners describe several categories of gaps. These labels are observational. They refer to typical contexts in which gaps appear rather than strict rules, and the same gap can be interpreted differently depending on surrounding price structure.
Common Gaps
A common gap tends to occur within a trading range without significant news or trend implications. It often reflects routine imbalances during quiet conditions and may later be overlapped as prices revert within the range. The defining feature is context, not size. A small gap inside a well-defined horizontal range is commonly described as common.
Breakaway Gaps
A breakaway gap appears when price opens outside a congestion area after a period of compression. The lack of overlap with the range that preceded it highlights a shift in conviction. The gap acts as visible evidence that the auction transitioned to a new area where participants are willing to transact. The size and follow-through vary, but the diagnostic feature is a gap that starts a move away from balance.
Runaway or Measuring Gaps
When a trend is already underway, a gap that appears during the move is often described as a runaway or measuring gap. The label reflects the observation that strong trends can contain intermittent jumps as new participants join the auction. The gap offers a visual cue of renewed urgency in the direction of the prevailing move.
Exhaustion Gaps
An exhaustion gap occurs late in a mature move when buyers or sellers appear to expend their remaining urgency in a final push. The defining characteristic is what follows. An exhaustion gap is often identified after subsequent price action shows deterioration in follow-through. Because the label depends on what happens next, it is better thought of as a retrospective description than a predictive category.
Island Gaps
An island is a short cluster of bars separated on both sides by gaps. For example, price gaps up, trades for one or several sessions at elevated levels, then gaps down below the prior area, leaving the interim bars visually isolated. The island pattern is memorable but uncommon. When it occurs, it highlights rapid repricing that later reverses, often around a discrete event or a sequence of events.
Why Gaps Occur
Gaps arise when the set of orders available at the open cannot clear at prices within the prior range. Several mechanisms can cause this, and they often interact.
Information Arrivals and Expectations
New information changes the distribution of expected future cash flows or risk. Earnings announcements, guidance updates, regulatory decisions, macroeconomic releases, geopolitical surprises, and sector-specific news can all shift expectations. If many participants wish to reprice at once, the opening auction finds a clearing price that reflects the updated consensus, which can be far from the prior close. The gap is the chart's imprint of that repricing.
Liquidity and Order Book Structure
The order book is sometimes thin at intermediate price levels, especially overnight. When market orders hit a sparse book, price can jump to the next level with meaningful resting liquidity. This creates the appearance of an air pocket. The same phenomenon can occur during intraday halts or at the resumption of trading after a limit-up or limit-down state. The microstructure detail varies by venue and asset class, but the basic idea is that price moves to the nearest level where enough counterparties are willing to transact.
Market Structure Across Asset Classes
Not all markets gap in the same way. Equities often exhibit daily gaps because regular trading hours are separated by a wide overnight pause. Futures trade more continuously but can still display gaps at illiquid times or after contract changes. Foreign exchange typically gaps at the weekly reopen. Crypto assets trade around the clock, which reduces daily gaps on spot charts, though discontinuities can still appear during outages or when liquidity concentrates in specific venues. Understanding the trading schedule and liquidity profile of an instrument helps set expectations about how often gaps might occur and how large they tend to be.
How Gaps Appear on Charts
The appearance of gaps depends on the chosen timeframe, the inclusion of extended-hours data, and whether the chart is adjusted for corporate actions.
Candlesticks, OHLC Bars, and Heikin-Ashi
On standard candlestick or OHLC charts, a gap is simply the absence of overlap between consecutive bars. Heikin-Ashi charts smooth price series by averaging components, which can reduce the apparent frequency of gaps. For the purpose of identifying actual discontinuities in traded prices, standard charts are more faithful to the underlying prints.
Intraday vs Daily Views
A daily gap may correspond to a sequence of trades in the pre-market that bridge some of the distance between the prior close and the regular-hours open. If the chart excludes pre-market data, those trades are not visible, and the gap looks larger. Conversely, if the chart includes extended hours, you may observe partial fills of the space. When comparing gaps across instruments, ensure that you are comparing like with like regarding session coverage.
Adjusted Data and Corporate Actions
Dividends, stock splits, and rights offerings can shift historical prices. Data vendors typically provide adjusted series that splice past bars to maintain continuity. On unadjusted data, a split can appear as a large artificial gap. On adjusted data, the historical prices are scaled to remove that discontinuity. For analysis focused on genuine gaps created by trading and information, adjusted charts are usually more representative, though it is important to understand how the adjustments are computed.
Interpreting Gaps Without Forecasting
Gaps communicate that the market had to jump to find counterparties. While many traders use gaps within systematic strategies, it is possible to draw value from observing gaps without prescribing specific actions. The following perspectives stay within descriptive interpretation.
Signal of a Volatility Regime Shift
A gap often coincides with a change in realized volatility. A large opening move widens the distribution of intraday returns and can affect how subsequent bars behave. Even if the gap itself is not traded, understanding that volatility has shifted helps frame the likelihood of wider intraday ranges or more rapid swings in the near term.
Areas of Interest in Price Discovery
The space of a gap sometimes marks a thinly traded zone. When price later returns to that region, liquidity can be uneven. Some market participants treat prior gaps as reference levels for order placement. Without assuming specific outcomes, it is reasonable to view gaps as noteworthy locations in the auction, similar to prior swing highs, swing lows, or high volume nodes.
Volume Context
Volume around a gap provides context. A gap that occurs alongside unusually high volume suggests broad participation in the repricing. A gap on relatively light volume can indicate that the clearing price moved mainly because the opposing side stepped away. This distinction does not dictate what happens next, but it helps explain the mechanics of the move.
On the Notion of Gap Fills
Practitioners often speak about gaps being filled, meaning price later trades back through the empty space. Many common gaps inside ranges are overlapped in subsequent sessions. Breakaway gaps that launch moves from balance sometimes persist for longer. Empirical studies on fill frequency vary by asset, timeframe, and sample period. The presence of survivorship bias, data-snooping, and regime dependence complicate general claims. As a result, the idea of gap fills is best handled as a tendency to observe and test, not as a rule.
Practical Chart-Based Context
Example 1: Upside Gap After Earnings
Consider a stock that closed at 50 before reporting quarterly results. The company releases a strong earnings surprise after the market close, along with higher guidance. Overnight, buy orders accumulate. The next morning's opening auction clears at 55, and the first regular-hours trade occurs above the prior day's high of 51. The daily chart now shows a visible gap from just above 51 to 55. Within the next hour, price trades between 54 and 57. The gap indicates a step change in expectations. Even without projecting outcomes, an observer can note that the session has likely entered a higher volatility regime and that the region between 51 and 55 is a thinly traded zone created by the auction jump.
Example 2: Downside Gap on Guidance Cut
Imagine a similar stock that issues a profit warning before the open. The prior close was 40, and the new information causes many holders to seek liquidity. The opening print is at 36, below the previous low of 39. The chart shows a gap from just under 39 to 36. Volume during the first minutes is heavy as the market absorbs the imbalance. Later in the day, price oscillates between 35.50 and 37.50, partially overlapping the gap space. The behavior illustrates how gaps can act as markers of stress in the auction where liquidity was initially scarce.
Example 3: Futures and Weekend Behavior
A liquid index future trades nearly around the clock. Midweek, the contract rarely shows daily gaps on regular charts because overnight trading bridges most transitions. Over the weekend, however, the market is closed. A geopolitical event on Saturday changes risk perception, and the Sunday evening reopen prints 0.6 percent below Friday's settlement. The weekly chart reveals a small gap, while the intraday chart shows a rapid move at the open followed by two-sided trade. The example emphasizes how market schedules shape the prevalence and size of gaps.
Measuring and Classifying Gaps
Quantifying gaps helps standardize comparisons across instruments and time. Several straightforward measures are commonly used.
Absolute and Relative Size
An absolute measure records the distance between the current open and the prior high or low in price units. A relative measure expresses the gap as a percentage of price. Many analysts also normalize by recent volatility. For example, dividing the gap size by the 14-day Average True Range allows comparison across instruments with different noise levels. Normalization reduces the tendency to overreact to dollar gaps on high-priced shares or to underweight small-dollar gaps on low-priced shares that represent large percentage moves.
Full vs Partial Gaps and Open Location
A full gap occurs when today's open is above yesterday's high for an upside gap or below yesterday's low for a downside gap. A partial gap occurs when today's open is above yesterday's close but not above yesterday's high for an upside gap, or below yesterday's close but not below yesterday's low for a downside gap. Analysts also note where the open falls within today's initial range. An open near the extreme can signal urgency, while an open that is quickly retraced can indicate that overnight orders were absorbed efficiently. These are descriptive observations rather than prescriptions.
Why Many Traders Pay Attention to Gaps
Market participants monitor gaps for several practical reasons that relate to risk, information, and price discovery.
First, gaps are a form of event risk. They can bypass standing orders and change the starting point of the next session's analysis. Awareness of gap behavior contributes to framing risk in instruments that commonly reprice outside regular hours. Second, gaps reveal information about the underlying narrative. A decisive gap often coincides with updated beliefs about fundamentals or about the balance of supply and demand. Third, gaps highlight locations on the chart that may attract attention later, such as the edges of the gap or the midpoint. This attention is itself part of market behavior because many participants reference widely observed levels.
Finally, gaps can mark transitions in the auction. A breakaway gap from a long consolidation visualizes the movement from balance to imbalance. A late-stage gap after a protracted run may capture crowding near the end of a move. None of these interpretations dictate what happens next, but they enrich the context in which subsequent bars are interpreted.
Pitfalls and Data Considerations
Interpreting gaps requires care to avoid common data and inference pitfalls.
Survivorship and Look-Ahead Bias
Analyses that restrict the sample to current index constituents can overestimate favorable behaviors because delisted or poorly performing names drop out. Likewise, labeling a gap as exhaustion only after the fact introduces look-ahead bias. When evaluating tendencies like fill frequency or subsequent volatility, use unbiased samples and evaluation windows.
Corporate Actions and Adjustments
Ensure that a gap is not an artifact of a split, special dividend, or symbol change. Most charting tools flag these events, but misinterpretations still occur when switching between adjusted and unadjusted series. If the goal is to analyze trading-induced gaps, adjustments are typically appropriate. If the goal is to reconcile with economic returns including distributions, understand how the vendor applies adjustments to past bars.
Extended Hours and Venue Coverage
Gaps look different when pre-market and after-hours trades are included. Instruments that trade on multiple venues can show slightly different prints at the open. For cross-listed securities or depository receipts, the home market's schedule can influence where gaps appear in secondary markets. When comparing gaps across datasets, check the session definitions and consolidation rules.
Halts, Limit States, and Auction Rules
Some gaps are associated with regulatory mechanisms such as volatility halts or limit-up and limit-down states. After a halt, the reopening auction can print far from the last trade. The same can happen when daily price limits are reached and later relaxed. These mechanics are part of the explanation for why gaps form and how large they become.
Integrating Gap Awareness into Price Action Analysis
Gaps can be integrated into a broader reading of market structure without prescribing strategies. They serve as visual markers of urgent repricing, as indicators of changing volatility states, and as potential reference zones in the ongoing auction. Noting whether a gap aligns with a transition from balance to trend, whether it arises with high or low participation, and how price behaves when revisiting the gap area can all inform interpretation of subsequent bars. The emphasis is on context, not prediction.
In practical terms, analysts often annotate gaps on their charts, measure their size relative to recent volatility, and track how the auction engages with the edges of the gap. Volume at price, session profiles, and time-of-day effects can provide additional texture. These practices do not imply that gaps determine future paths. They help structure observation so that the analyst recognizes when price is traversing a region created by a discontinuity.
Frequently Observed Questions
Do all gaps fill
No. Some gaps are overlapped quickly, especially within broad ranges, while others persist for months or years. The probability and timing of any fill depend on many variables, such as the nature of the catalyst, the broader market environment, and the instrument's liquidity. Historical averages from one sample do not necessarily apply to another.
Are large gaps more significant than small gaps
Size matters in context. A two percent gap on a high-volatility instrument may be routine, while a one percent gap in a low-volatility instrument may indicate a major repricing. Normalizing by recent volatility helps prevent misclassification.
Can an intraday chart show gaps during the day
Yes. Gaps can appear during intraday trading around halts, news releases, or transitions between trading sessions. Very short timeframes can also show micro-gaps when no trade occurs at intermediate price levels, though these are less consequential than session gaps.
Practical Annotation Tips
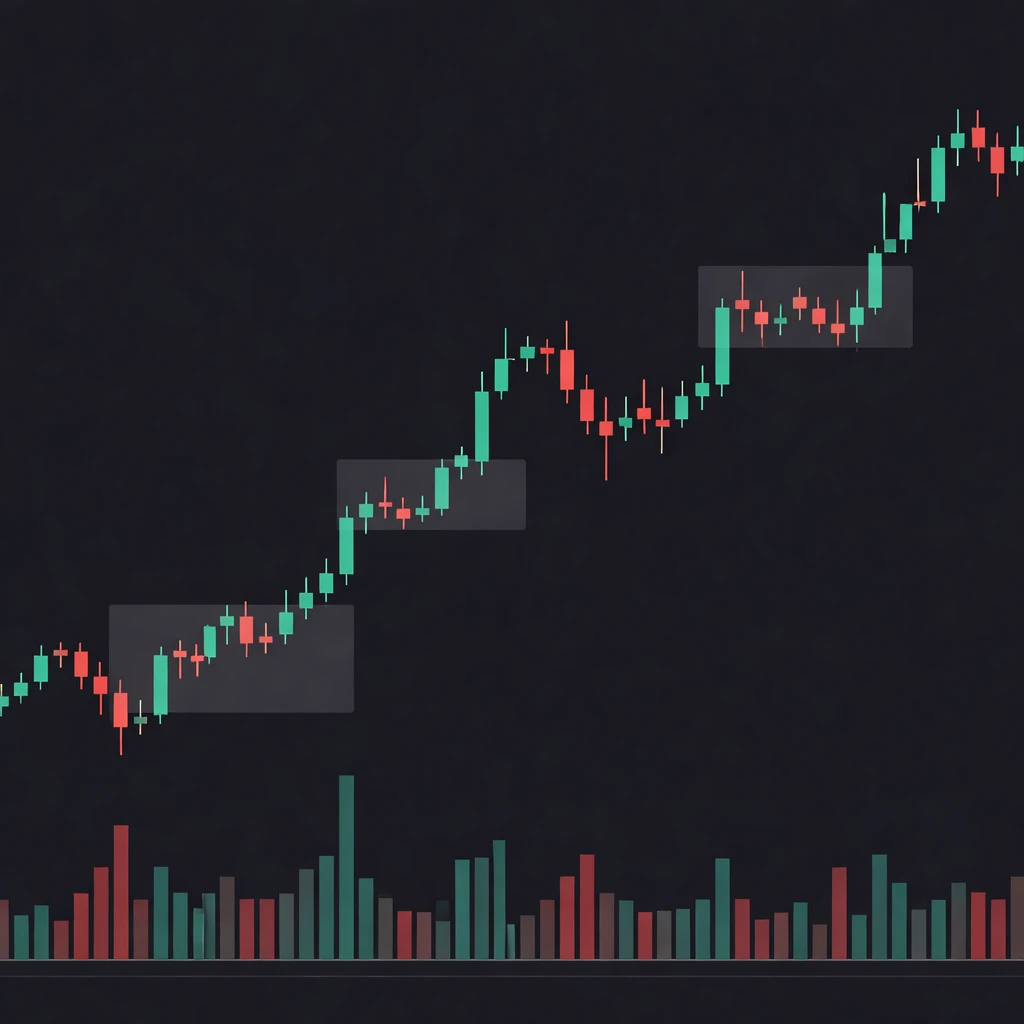
Analysts commonly draw rectangular shading over the gap area to keep it visible in future sessions. Marking the top and bottom edges helps align later observations about whether price respects, ignores, or traverses the zone. It is also helpful to note the volume profile around the gap and any changes in intraday range that occur after the gap appears. These annotations aid memory and encourage consistent observation.
Closing Perspective
Price gaps are a visible consequence of how markets process new information and allocate liquidity. They capture moments when participants collectively decide that the previous trading range no longer reflects the consensus valuation. By recognizing a gap's context, measuring it appropriately, and understanding the data features that shape its appearance, an analyst can read charts with greater precision. The emphasis remains on interpretation and description rather than prediction.
Key Takeaways
- A price gap is a discontinuity where consecutive bars do not overlap, often created by opening auctions or liquidity imbalances.
- Context defines gap types such as common, breakaway, runaway, exhaustion, and island, and the same visual can have different interpretations across regimes.
- Gaps signal changes in the auction and often coincide with shifts in realized volatility and participation, but they do not imply a specific future path.
- Chart appearance depends on timeframe, extended-hours inclusion, and data adjustments, so comparisons require consistent datasets.
- Using gaps as reference zones and measuring them relative to recent volatility supports clearer price action analysis without prescribing trades.