Price action is the direct observation of price changes on a chart without relying primarily on derived indicators. Within that broad practice, context is the organizing principle that gives individual price movements their meaning. A single candle, a pattern, or a breakout bar rarely speaks for itself. The informational value of any price print depends on where it appears, when it occurs, and how it relates to the structure that came before it. Context allows an analyst to frame price action inside a narrative of market behavior rather than treating each tick in isolation.
Defining Context in Price Action
Context in price action refers to the background conditions that shape the interpretation of current price behavior. It is the set of structural, temporal, and behavioral cues surrounding a move. These cues include the higher timeframe trend, recent swing structure, proximity to important reference points, volatility regime, session timing, and the presence of known catalysts. Each of these elements affects how an analyst reads the same price movement. A strong bullish candle inside a broader downtrend, for example, may signal a normal countertrend bounce rather than a meaningful shift in control.
Context is not a trading strategy. It is a lens. The lens clarifies what price is doing relative to where price has been and to the conditions under which it now moves. Analysts use contextual clues to sort price action into categories such as trend continuation, range behavior, absorption, rejection, or transition. These categories are descriptive, not prescriptive. They help avoid reading too much into isolated candles or short sequences of bars.
Why Context Matters
Markets exhibit path dependence. What happened over the last days, weeks, or hours constrains what is likely to occur next. Context captures this dependence. When analysts describe a market as trending, rotational, or balanced, they are summarizing context. When they highlight a prior high that has been tested multiple times or a large gap that remains open, they are pointing to contextual anchors that may influence how participants respond to new information.
Context matters because it shapes expectations about variability, not because it predicts a specific outcome. Interpreting price action with context helps in three important ways:
- Signal quality: The same candle pattern can have different implications depending on trend direction, location within a range, and volatility conditions.
- Risk characterization: Context sheds light on the breadth of plausible paths and the speed with which price may travel those paths.
- Timeframe alignment: Reading a five-minute move inside a weekly structure prevents time compression bias, where small moves appear large when viewed narrowly.
Core Components of Context
1. Trend and Structural State
At a basic level, trend is visible through sequences of swings. Higher highs and higher lows indicate an uptrend. Lower highs and lower lows indicate a downtrend. Alternating highs and lows centered within a horizontal corridor suggests a range. The current leg of price should be read against the backdrop of the dominant sequence. A strong bullish candle inside a mature downtrend often marks a corrective leg unless subsequent structure changes. Conversely, a modest pullback during a well-defined uptrend may simply represent reversion toward the mean inside a continuation phase.
Structure also includes the clarity of swings. Clean, impulsive legs with shallow and brief pullbacks reflect decisive control by one side. Overlapping, choppy bars with frequent retracements point to two-sided trade, where neither side can carry price far before meeting resistance. Reading the character of swings helps distinguish trend from rotation.
2. Location Relative to Reference Points
Price has memory in the sense that many participants recall locations where meaningful interaction occurred. Typical references include:
- Prior swing highs and lows on the higher timeframe.
- Recent range boundaries and value areas identified by prolonged balance.
- Gaps that have not been filled and which may remain focal points for later trade.
- Opening prices and previous session extremes in intraday analysis.
When current price approaches or rejects these locations, the same bar shapes take on different meanings. A small-bodied candle with a long lower shadow near a major higher timeframe support carries different information than the same candle sitting in the center of a multi-week range. Location calibrates how much information a bar conveys.
3. Volatility Regime
Volatility affects how far and how fast price tends to move. A narrow-range environment with contracting true range tells a story of compression and patience. A wide-range environment with expanding true range suggests urgency or uncertainty that allows larger displacements. The same two-point move can be notable in a quiet regime and trivial in a volatile regime. Analysts often measure regime by simple observations of bar ranges, recent average true range, and the frequency of gaps. Volatility shifts commonly precede changes in behavior. Contraction often leads to expansion, although the direction of expansion is not set by the contraction itself.
4. Time and Session
Time is an often overlooked contextual dimension. Intraday, the first hour of many markets tends to feature higher participation and sharper price discovery. Midday often reflects slower trade and more overlap. The close can be active as participants rebalance. Across days, the start of a week or month can bring flows that differ from mid-period activity. Larger macro or earnings calendars can alter participation around specific times. Reading a breakout attempt minutes before a scheduled data release is different from reading the same attempt in a quiet period. The bars may look similar, but the time context alters the distribution of follow-through.
5. Participation and Volume
Although price action analysis can be performed without volume indicators, awareness of participation level is part of context. Wide ranges on thin activity often unwind quickly once more participants arrive. A marginal new high printed on visibly low volume compared with recent sessions tells a different story than a new high on heavy participation. The point is not to forecast, but to recognize that the quality of a move depends partly on who is active and how much inventory is changing hands.
6. Multi-timeframe Alignment
Context is hierarchical. Higher timeframe structure exerts a gravitational pull on lower timeframe behavior. An analyst often starts with a weekly or daily chart to identify the dominant environment and then steps down to a four-hour, one-hour, or intraday chart to study the details. A lower timeframe breakout that aligns with a higher timeframe trend and location will be read differently from a breakout that pushes into significant higher timeframe resistance. Aligning timeframes prevents overreliance on local noise.
7. Catalysts and Information Flow
Scheduled catalysts such as earnings announcements, policy decisions, or major economic releases can cause abrupt changes in volatility and participation. Context includes awareness of whether a move occurs into, during, or after such events. A pre-event drift in narrow bars is often repriced quickly when information hits the tape. A post-event bar has a different meaning if it retraces a large gap versus extends it. The chart may show the same candle shape, but the information context surrounding that candle is distinct.
How Context Appears on Charts
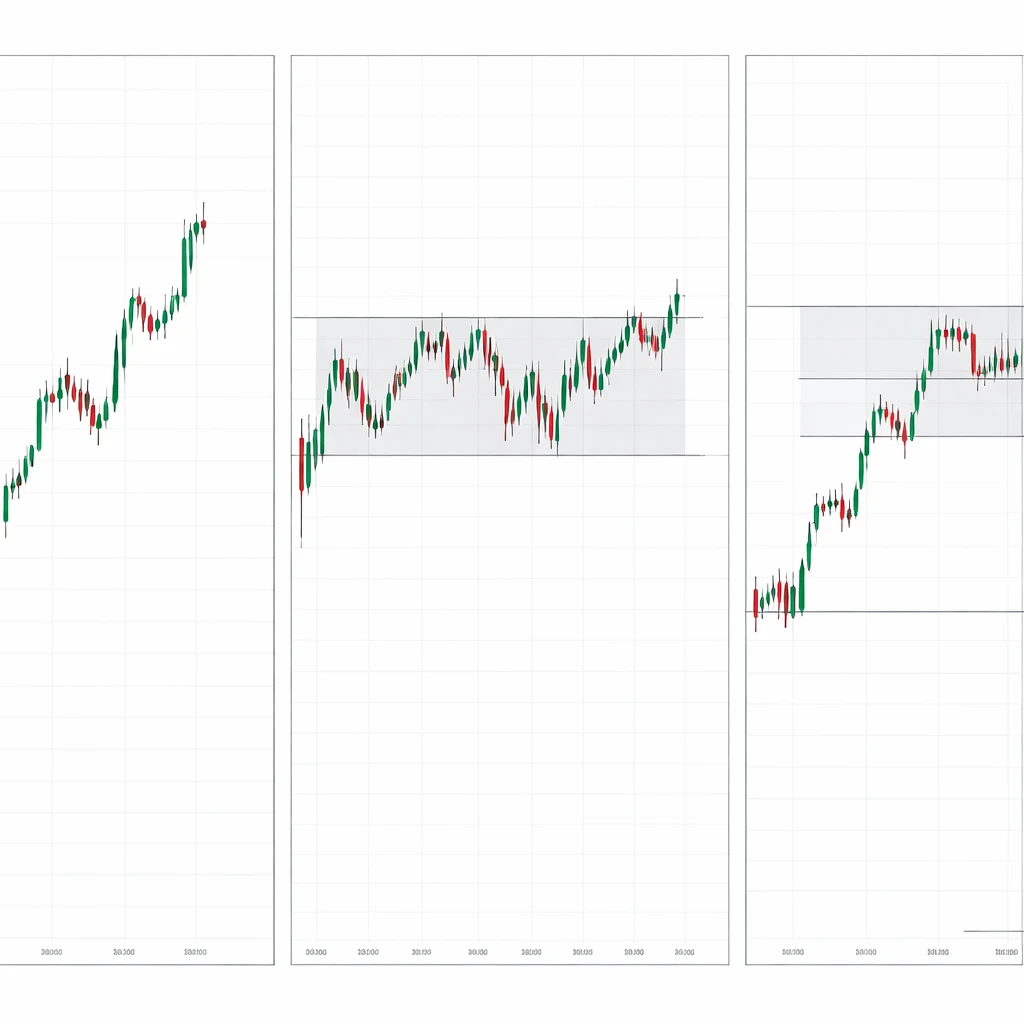
Context is not a hidden variable. It is visible through the arrangement of swings, the spacing between bars, and the relationship between price and known references. The following chart features illustrate how context becomes concrete:
- Repeated testing of a boundary: Multiple approaches to a range high or low without decisive resolution often show exhaustion or absorption, depending on how the tests occur. Long wicks rejecting the same level repeatedly indicate consistent supply or demand. Tight consolidation pressing against a boundary suggests ongoing acceptance and potential transition.
- Impulse versus correction: Fast, wide bars traveling with little overlap reflect impulse. Slow, overlapping bars in the opposite direction reflect correction. The same candle is interpreted in light of whether it sits inside an impulsive leg or a corrective pause.
- Gaps and follow-through: A gap that holds and leads to directional bars signals a change in inventory or expectations. A gap that quickly fills may indicate a mispricing corrected once broader participation engages. The location of a gap relative to higher timeframe references helps interpret its significance.
- Volatility compression: A visible sequence of narrowing ranges or a triangle-like formation shows compression. The meaning lies less in the shape and more in the regime shift it represents. Compression signals that the market is storing potential energy, not that it must release it in a specific direction.
- Time-of-day behavior: Intraday charts often show a push during the open, a drift or rotation during midday, and renewed interest near the close. Moves occurring against these typical patterns may be read differently than moves that conform to them.
Illustrative Chart-Based Contexts
Example 1: Pullback Within a Higher Timeframe Uptrend
Consider a daily chart that has been printing higher highs and higher lows for several weeks. The last push created a new high on increased range. Over the next three days, price retraces in smaller bars with overlapping bodies and reduced range. The pullback pauses near a prior consolidation that acted as resistance earlier in the trend and now sits just below current price. On a four-hour chart, the retracement appears as a choppy rotation with brief attempts to push lower that are met by swift recoveries. This context suggests that the recent down movement is corrective action within a dominant uptrend. The informative element is not a specific candle pattern. It is the alignment of trend, location near a former congestion, and the slower, overlapped character of the retrace compared with the prior impulse.
An analyst who reads this context sees a market that remains structurally constructive on the higher timeframe while undergoing mean reversion on the lower timeframe. The interpretation remains descriptive. It acknowledges that a shift to lower lows on the daily would change the read, and that a sudden volatility expansion would alter the calculus.
Example 2: Range Behavior and Failed Extension
Imagine a multi-week range bounded by well-defined highs and lows. Price approaches the upper boundary after several sessions of grind higher in small increments. On the test day, the market opens firm, probes a few ticks above the prior high, and prints an upper shadow as sellers respond. Subsequent bars return price into the body of the range, and the session ends near its midpoint. On the following day, price remains contained within the prior day range.
This context shows a rotational environment where attempts to extend beyond the established boundary have struggled to find acceptance. The long upper wick at the range edge, combined with a return to prior value, reflects responsive supply near a known reference. The failed extension does not imply a directional forecast. It indicates that, at that moment, higher prices did not attract sufficient new demand to establish value outside the range.
Example 3: Volatility Contraction Ahead of a Scheduled Event
Suppose an index has compressed over a week into a narrowing series of daily ranges. The calendar shows a significant policy announcement scheduled for the next session. Intraday, the last day before the event trades with unusually small bars and limited distance traveled. The context is a classic compression regime set against a known information catalyst. The contraction speaks to hesitation and inventory reduction. The lesson is not that a breakout in a specific direction should be expected. Rather, it is that the informational value of any post-event move will be higher, because it occurs after a period of compression and in response to new information.
Example 4: Intraday Opening Drive and Later Reversion
On a five-minute chart, a liquid future opens with a swift directional move that travels a significant portion of the prior day range within the first 20 minutes. The pace slows, and later in the session price rotates around a newly formed intraday balance. The context is a two-part day: discovery early, balance later. Individual bars within the opening push read differently than bars printed during the rotation. A failed breakout from the midday balance is not the same phenomenon as the rejection of a premarket level during the open. Time and session structure are part of the context that gives each move its meaning.
Common Pitfalls When Context Is Ignored
Analysts who focus on isolated candles or local patterns without context often run into predictable problems. The following pitfalls arise from treating every bar as equal in meaning:
- Overweighting micro patterns: A small reversal pattern in the middle of a wide higher timeframe range carries little information. Without location and trend context, it can be misread as significance when it is ordinary noise.
- Timeframe myopia: Confident interpretations on a five-minute chart that ignore the daily structure can invert cause and effect. A lower timeframe pullback may simply be a detail inside a higher timeframe continuation.
- Assuming symmetry: Expecting mirrored behavior at highs and lows or after equal measured moves can lead to misplaced certainty. Price often displays asymmetry because participation and liquidity are not constant across levels or time.
- Treating all gaps alike: A gap occurring in the middle of a range differs from a gap that clears a multi-week high. The background determines whether the gap likely represents new information being priced or a temporary dislocation.
- Ignoring regime shifts: Interpreting bars printed during elevated volatility with habits formed in a quiet regime can distort risk perception. Range, pace, and slippage change across regimes.
Linking Context to Uncertainty
Context refines the distribution of plausible outcomes without selecting a single path. In a balanced market, rotations are common, tails are shorter, and reversals are frequent. In a trending market, continuation is common, tails can be shorter in the trend direction and larger against it, and reversals require structural change. In a compression regime, variability is low until a release occurs, at which point variability can increase quickly. These statements are not forecasts; they frame uncertainty in ways that can be examined with historical observation. Context helps an analyst judge whether a current move is typical given the environment or whether it is unusual and thus more informative.
This perspective also encourages conditional thinking. If the higher timeframe remains intact, then local countertrend moves are treated as corrective. If a boundary that has contained price for weeks is accepted and built upon, then the environment may be transitioning. If a catalyst enters the scene, then the informational content of bars printed after the event rises relative to bars printed before it. Such conditional logic is descriptive. It avoids rigid rules and emphasizes observation.
Building a Context Checklist
A structured checklist helps keep analysis disciplined and repeatable. The goal is to ask consistent questions that situate current price behavior inside its proper frame. Examples of context questions include:
- What is the higher timeframe structure: trend, range, or transition, as defined by swing sequences and the clarity of recent legs?
- Where is current price relative to key references such as prior weekly highs and lows, recent balance areas, gaps, and the previous session range?
- What is the current volatility regime as seen through recent bar ranges, gaps, and the speed of movement?
- What time is it within the session or the week, and are there known catalysts that could alter participation?
- How does the lower timeframe action align with the higher timeframe? Are impulses and corrections obvious and consistent across scales?
- Is there evidence of acceptance or rejection at important locations, visible as consolidation, repeated testing, or swift reversals?
These questions keep attention on structure and location rather than on isolated shapes. They also promote patience in interpretation, which reduces the temptation to read certainty into ambiguous situations.
Practical Chart Reading Workflow
Analysts often find it useful to approach charts in a top-down sequence that emphasizes context before detail. The steps below outline a neutral workflow oriented toward observation:
- Start with the higher timeframe, such as weekly or daily, to classify the environment. Mark the major swing highs and lows and any extended balance areas. Note whether recent legs look impulsive or corrective.
- Identify reference levels that are likely to matter to participants. These can include prior range boundaries, gaps, and significant swing points. Keep the set of references minimal to avoid clutter.
- Assess the volatility regime by comparing recent ranges with historical ranges over a relevant window. Look for signs of compression or expansion.
- Note the calendar and session context. If a catalyst is approaching, treat pre-event movement as less informative than post-event movement.
- Step down to the intermediate and then to the execution timeframe only after the higher timeframe frame is clear. Observe how lower timeframe swings relate to the larger structure.
- Update the context as new information arrives. Acceptance of price beyond a key boundary or a marked change in volatility regime should adjust the working narrative.
Throughout this workflow, the purpose is to anchor interpretation. The same five-minute breakout bar means something very different when it occurs at the center of a multi-week range versus when it occurs after acceptance above a prior weekly high. The workflow ensures that such distinctions are made consistently.
Interpreting Specific Chart Features Through Context
Long Wicks and Rejections
Long upper or lower shadows often indicate that price explored an area and was pushed back. Context determines whether this exploration is significant. A long upper wick that pierces a multi-month high and closes back within the prior range signals a failed attempt to accept higher prices at that time. The same wick in the middle of a wide range carries less weight. Time also matters. A rejection printed near the open can reflect thin liquidity, while a rejection late in the day might follow fuller participation.
Inside Bars and Narrow Range Days
Inside bars on daily charts compress information. Whether they are meaningful depends on what preceded them and what follows. A cluster of inside bars after a prolonged trend can indicate digestion and inventory rebalance. A single inside bar after a volatile reversal may be a simple pause. Sequences of narrow range days often preface larger movement, but the direction is a function of who dominates once the stalemate breaks, not of the pattern itself.
Breakouts and Acceptance
Breakouts are contextual events. Breaking a clearly defined boundary is different from printing a local high in an arbitrary location. Analysts often look for signs of acceptance beyond the boundary, such as the ability to hold above it during pullbacks or to build a new balance. Failure to accept usually shows up as swift return into the prior range. The presence or absence of acceptance is not a forecast tool. It is a descriptor of whether the market is reorganizing value around a new area.
Gaps and Overnight Moves
In many markets, a gap between sessions changes reference points abruptly. Reading the open in relation to the prior session high and low provides context for the initial push. Large gaps that open beyond a multi-day balance have different implications than small gaps that occur within it. Post-gap behavior helps establish whether the new information is being accepted or faded.
Why Analysts Pay Attention to Context
Analysts study context in price action to increase the reliability of their interpretations. Context attaches conditions and boundaries to statements about what price is doing. This is valuable for several reasons:
- Consistency: A contextual framework supports consistent analysis across different market environments and instruments. It reduces impulsive reactions to unusual but insignificant bars.
- Comparability: Context allows for meaningful comparisons across timeframes. A move that looks dramatic on a one-minute chart can be ordinary on a daily chart. Anchoring to the higher timeframe aligns interpretations.
- Error control: Many analytical errors arise from ignoring where price sits relative to prior structure or from forgetting that volatility varies over time. Context serves as a guardrail against such errors.
- Communication: Contextual language makes analysis more precise. Phrases like “testing prior range high,” “compressing ahead of event,” or “corrective pullback within uptrend” convey the environment without implying certainty.
Applying Context Without Prescribing Actions
Contextual reading of price action invites disciplined observation. It does not require specific rules or fixed patterns. Analysts may keep annotated charts that mark key reference levels, track changes in volatility, and note how price responds around those markers. The annotations record the shifts in environment rather than insisting on prediction. Over time, these records create a library of contextual situations and how they resolved, which can be useful for study and for refining one’s interpretive skill.
Importantly, context is dynamic. A new high that is initially rejected might be accepted later after additional tests. A range can transition into a trend when enough participation agrees to value a new area. Volatility regimes rotate. Therefore, contextual analysis must be updated continuously with each new bar.
A Note on Objectivity and Bias
Reading context involves judgment, which means it is vulnerable to bias. To reduce subjectivity, many analysts standardize how they draw swing points, define balance areas, and select reference levels. They also limit the number of elements considered at any one time. Charts cluttered with lines can obscure rather than clarify context. Objective rules for identifying structure can help, but they should not be so rigid that they ignore obvious behavior. Balance is achieved by combining simple, repeatable methods with flexibility in interpretation.
Key Takeaways
- Context in price action is the background of trend, structure, location, volatility, time, and participation that gives individual price movements their meaning.
- The same candle or pattern can imply different things depending on where it occurs relative to higher timeframe references and the prevailing volatility regime.
- Charts reveal context through swing sequences, repeated tests of boundaries, compression and expansion, gaps, and time-of-day behavior.
- Ignoring context often leads to overinterpreting small patterns, timeframe myopia, and misreading regime shifts.
- Context is descriptive, not predictive. It frames uncertainty and improves consistency and clarity in analysis without prescribing specific actions.