Consolidation patterns describe periods when price compresses into a relatively contained range after a move or during a pause in trading activity. Price often oscillates between nearby highs and lows, candles overlap more than usual, and realized volatility tends to decline. Consolidations are common across markets and timeframes. They reflect a temporary balance between buying and selling pressure, during which the market is absorbing information and liquidity before the next expansion in range.
Understanding consolidation is central to price action analysis because the structure of a pause often contains information about the state of supply and demand. Analysts watch these pauses to interpret whether the market is in balance, whether pressure is building for a range expansion, and how the character of the move changes as liquidity and volatility evolve. The focus is interpretation rather than prediction. The same consolidation can resolve higher or lower, and its value lies in clarifying context, not in guaranteeing a directional outcome.
What Are Consolidation Patterns?
A consolidation pattern is a recurring price behavior marked by one or more of the following features:
Price containment. The market trades within a relatively narrow high to low interval compared with the preceding swing. Highs and lows cluster, and repeated tests of the boundaries fail to produce sustained directional progress.
Increased overlap. Consecutive candles overlap substantially. On many bars, both the open and close fall within the range of the previous bar. Sequences of inside bars or alternating small bodies are common.
Volatility contraction. The absolute size of bars tends to shrink. Measured volatility, such as the average true range or the standard deviation of returns, often declines relative to earlier periods.
Time spent in balance. The market spends multiple sessions or multiple intraday rotations in a tight area. Consolidations can last for minutes on fast charts or for weeks on daily charts, but they are characterized by time building up without decisive displacement.
These attributes do not require an exact geometric shape. Some consolidations appear as clean rectangles with horizontal boundaries. Others compress diagonally into a triangle or a wedge. What matters for interpretation is the combination of containment, overlap, and reduced net progress.
How Consolidation Appears on Price Charts
Visual Characteristics
On a candlestick chart, consolidation typically shows up as a cluster of bars occupying roughly the same vertical space. Many bars close near the middle of the range, and extremes are rejected. Wicks may probe beyond the developing boundary, then prices return to the prior range. That behavior signals a temporary lack of follow through.
Overlapping highs and lows are a practical cue. If several consecutive candles share similar highs or similar lows, the market is repeatedly testing the same area without initiating a trend. Small-bodied candles or doji-like bars often populate the cluster. This does not guarantee equilibrium, but it suggests indecision or matched pressure from both sides.
Range compression is another tell. If the distance between the highest high and lowest low over a rolling window is shrinking, the market is compressing energy into a smaller space. Compression can be gradual, with lower highs and higher lows forming a triangle, or abrupt, with a sudden freeze into a tight box after a fast move.
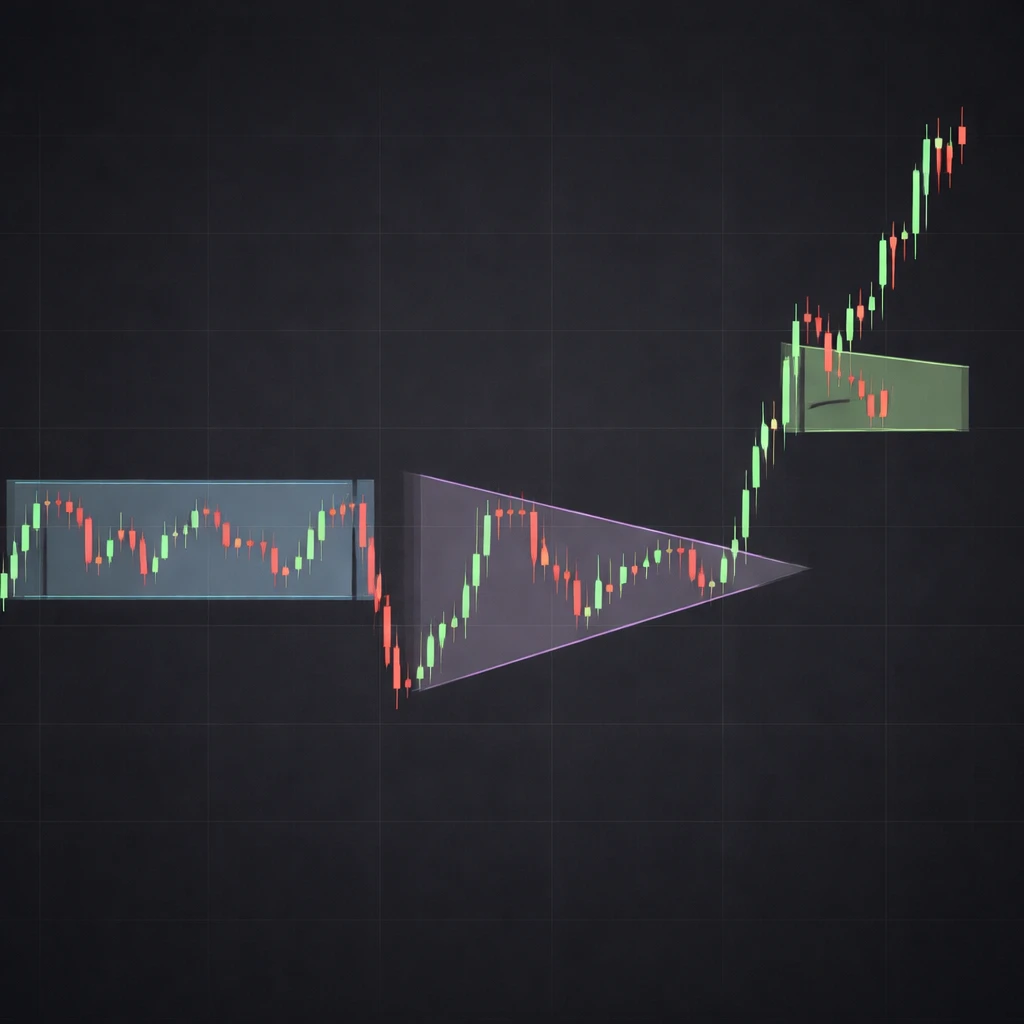
Common Geometric Forms
Rectangular ranges. Price oscillates between a relatively flat ceiling and floor. Multiple touches occur on both boundaries, and mid-range trading is choppy. This is the most intuitive form of consolidation because it visually resembles a shelf or base.
Symmetrical triangles. Highs step lower, lows step higher, and the range narrows. The apex forms as time passes without decisive initiative from buyers or sellers. Triangles emphasize the compression dimension of consolidation.
Flags and pennants. After a swift directional leg, price pauses in a tight, often sloping channel or a very small triangle. Despite the labels, the defining feature is a brief, orderly pause with reduced range compared with the impulse that preceded it.
Rising or falling channels with decreasing amplitude. Price trends gently while the swing-to-swing distance diminishes. This can function as consolidation, particularly when momentum fades and each move attracts counterflow quickly.
Labels vary among textbooks and platforms. The underlying price action is consistent: the market is in balance, trading repeatedly through the same prices with limited net displacement.
What Consolidation Signals About Market Behavior
Consolidation reflects a temporary equilibrium. Buyers and sellers are willing to transact at similar prices, and each attempt to push away from the area meets sufficient opposing liquidity. Several microstructural forces contribute to this behavior.
Liquidity seeking. Large participants often require volume to execute. When liquidity concentrates near certain prices, activity tends to cluster. That clustering can look like a base or a box on a chart. Repeated revisits to a price area help aggregate liquidity from participants who were not present on the first test.
Information absorption. Markets discount new information at different speeds. After a sharp move that reflects a new data point, a consolidation phase can indicate that participants are evaluating how persistent the new information will be. Trading stabilizes while expectations converge.
Volatility clustering. Financial time series often exhibit stretches of low volatility followed by expansions. Consolidation is the low volatility phase. It is not inherently bullish or bearish. It simply marks a lower variance regime that tends to be followed, at some point, by a higher variance regime.
Inventory and positioning. Dealers and short-term participants manage inventory around ranges. If many participants accumulate offsetting positions near the same prices, their hedging and rebalancing can reinforce containment. The result is a self-reinforcing balance until an exogenous shock or a gradual shift in pressure disturbs it.
Because consolidation concentrates trading activity, the boundaries of a consolidation often become psychologically salient. Market participants reference those recent highs and lows when evaluating subsequent price behavior. That salience can influence how aggressively orders enter the market near those levels, which in turn affects the path of prices when range conditions change.
Distinguishing Consolidation from Other Patterns
Consolidation is sometimes conflated with accumulation or distribution. The visual similarities can be strong, but the interpretations differ. Consolidation is a descriptive term about price containment and volatility contraction. Accumulation and distribution are directional attributions that imply net buying or net selling by informed participants. Without additional evidence, such as a persistent imbalance in flows, price alone cannot reliably separate the two.
Consolidation also differs from a simple pullback. A pullback retraces part of a prior move with relatively directional price action inside the retracement. Consolidation, by contrast, spends time moving sideways with overlapping bars and limited net retracement. The essential element is time spent in balance rather than distance retraced.
Finally, not every small range qualifies as meaningful consolidation. Illiquid instruments can print tiny, irregular ranges due to limited trading, not due to a balanced auction. Context matters. A compact box after a heavy volume swing carries different informational content from a similar box in a thinly traded market during a holiday session.
Ways to Contextualize Consolidation
Interpreting consolidation benefits from explicit context. Several practical dimensions help give structure without prescribing trades.
Duration. The amount of time spent in balance affects how participants perceive the consolidation. A three-bar pause is different from a twenty-session range. Longer pauses can attract more participation and can shift the reference price investors use to anchor expectations.
Volatility ratio. Comparing the height of the consolidation to the range of the prior impulse provides a sense of compression. A narrow range that is small relative to the previous leg indicates stronger contraction than a broad box that is nearly as tall as the preceding move.
Range uniformity. Clean consolidations often show multiple touches of both boundaries. Ranges that drift diagonally without repeated tests might be channeling rather than balancing. The frequency of boundary tests can offer a sense of how often liquidity is found and whether attempts to escape the area quickly fail.
Volume and participation. While price action analysis can be conducted without indicators, volume data can contextualize the pause. Diminishing volume during balance suggests fading initiative, while persistent or rising volume inside a tight range suggests active two-sided trade. Either case still qualifies as consolidation. The difference lies in which types of participants may be most active.
Timeframe alignment. A consolidation on a 5-minute chart might be invisible on a daily chart. Conversely, a weekly base can translate into months of intraday ranges. Analysts often evaluate consolidations within a higher timeframe narrative to avoid overreacting to noise on a single chart.
Proximity to catalysts. Scheduled events such as earnings announcements or macroeconomic releases can trigger consolidation as participants wait for information. In those situations, the pause may be more about event risk than about technical balance alone.
Practical Chart-Based Examples
Example 1: Rectangular Range after a Trend
Suppose a large-cap equity rallies from 48 to 57 over ten sessions following an earnings surprise. After the spike, price trades between 56.20 and 57.40 for eight sessions. The intraday highs repeatedly stall near 57.30 to 57.40, and dips are bought between 56.20 and 56.40. Average daily range declines from roughly 2.00 during the rally to 0.60 during the range. Candle bodies become smaller, and several inside days appear.
What can be inferred? First, the market is in balance near the new information. Participants who missed the initial move now transact in the compact area, while earlier buyers and short sellers rebalance. Second, the shelf of overlapping candles creates a visible reference. Future price movements that interact with this area may attract attention because many participants traded there. None of this implies a guaranteed outcome. The purpose of the example is to illustrate what consolidation looks like and why it becomes a focal point for analysis.
Example 2: Symmetrical Triangle after a Sharp Intraday Move
Consider an index future that gaps higher on a positive premarket data release. In the first hour, price climbs rapidly, then begins to print lower highs and higher lows through midday. The triangle draws in participants on both sides as the range narrows from 12 points to 5 points over several rotations. Liquidity concentrates toward the apex because market orders have slowed, and resting limit orders dominate the tape.
This midday triangle is a textbook form of compression. The narrowing range signals that price discovery has slowed. Traders may infer that the next change in volatility will be significant relative to the quiet midday tape, but the direction remains uncertain. The triangle serves as a container for that uncertainty.
Example 3: A Tight Flag within a Larger Channel
Imagine a currency pair trending steadily higher inside a rising channel on the 4-hour chart. After a strong push, the pair drifts sideways to slightly lower in a very tight corridor for three bars. Each bar overlaps the previous one almost entirely, and the total height of the flag is small relative to the preceding swing. The behavior communicates a pause rather than a reversal. It also shows that market participants who were aggressive during the impulse have backed off, allowing price to settle while inventory and expectations reset.
These examples focus on the visual and contextual traits of consolidation. They exclude timing or execution guidance. The aim is to build recognition skills that help interpret the flow of price action as it moves from trend to balance and back again.
Data and Measurement Considerations
Analysts often seek objective measures to complement visual judgment. Although consolidation is visually defined, several quantitative cues can provide consistency.
Overlap metrics. One simple approach is to count how often a bar’s high is below the prior high and its low is above the prior low. A sequence of inside bars is rare, but multiple instances of partial overlap are typical in consolidations. Another variation counts the percentage of bars whose closes fall within the prior bar’s range. Higher overlap signals greater balance.
Range compression ratios. Compare the height of the recent n-bar high-low range to the height of the previous n-bar range. Values below a chosen threshold indicate contraction. This is straightforward and grounded in the geometry of price movement.
Realized volatility. Statistical volatility measures such as the standard deviation of returns or the mean true range can be computed over rolling windows. Downshift in these estimates is characteristic of consolidation, especially when the downshift is material relative to the earlier window.
Participation proxies. If volume data are available, changes in participation can clarify whether balance is occurring on light or heavy activity. Balance on light activity may reflect a lack of urgency, while balance on heavy activity can reflect vigorous two-sided trade.
Measurement does not replace interpretation. A compact range inside an illiquid instrument might satisfy a compression ratio but still carry little informational value because a single order could distort the pattern. Likewise, a consolidation identified by statistical criteria can be interrupted by an unscheduled news event at any time. The role of metrics is to provide discipline in recognition, not to overrule context.
Limitations and Common Misinterpretations
Equating shape with certainty. A rectangle, triangle, or flag is only a description of how price has moved. It does not encode certainty about what follows. Markets have many paths to resolution, and the same consolidation can precede very different outcomes depending on broader conditions.
Ignoring higher timeframe context. A neat consolidation on a 15-minute chart might sit directly under a multi-month resistance area. Conversely, a small box on a daily chart may be noise within a larger weekly trend. Without a frame of reference, the informational content of the pause can be overstated.
Overfitting historical examples. It is tempting to collect instances where a particular consolidation preceded a large move in one direction and to generalize from them. Survivorship bias and selection bias can distort those collections. Balanced analysis accounts for the instances that did not lead to clean continuations or reversals.
Confusing low volatility with low risk. Consolidation reduces typical bar size, but that does not guarantee smaller potential losses or gains once volatility shifts. Low volatility regimes can transition rapidly. The contraction is descriptive of the present, not predictive of the magnitude or direction of change.
Neglecting liquidity conditions. Holidays, off-hours trading, and thinly traded instruments can produce artificial-looking consolidations. Without sufficient two-sided participation, a pattern that appears balanced may simply be a byproduct of reduced activity.
Using Consolidation in a Broader Analytical Framework
Consolidation gains meaning when combined with other elements of analysis. Several dimensions are often considered alongside the pattern without dictating specific actions.
Preceding and following swings. The location of the pause relative to prior moves provides context about who is likely trapped or rewarded. A consolidation after a rapid move invites inventory rebalancing and can draw in countertrend participants who later influence how the range resolves.
Event sensitivity. When consolidations form near known catalysts such as policy announcements or earnings calls, the pattern may be more about information waiting than about pure technical balance. Analysts often treat these differently in their narratives because the timing of range resolution can be tied to the event.
Microstructure cues. Frequent false breaks and immediate rejections at the boundary can indicate an active mean-reverting tape inside the box. Cleaner tests with shallow pullbacks can imply that one side is gradually applying pressure, even if the range holds. These observations describe behavior without committing to directional forecasts.
Multiple timeframe synthesis. A daily consolidation occurring within a weekly uptrend and above a long-term reference communicates something different from the same daily consolidation that sits below a multi-year high. Synthesis does not require predictions. It situates the pattern in a hierarchy of reference points.
Role of time. Time spent in balance can matter as much as price distance. Some analysts view extended dwell time as the market’s way of building consensus about value. Whether or not the consensus persists after the range resolves depends on new information and liquidity, not on the duration alone.
Why Traders Pay Attention to Consolidation
Market participants follow consolidation for several reasons that align with the descriptive nature of price action.
Clarity about balance. Consolidation highlights where the market finds two-sided agreement. That clarity provides a map of recent acceptance and rejection zones, which is useful for interpreting subsequent behavior.
Volatility regime shifts. Periods of contraction in range often precede periods of expansion. Identifying these transitions helps analysts interpret when the character of the tape changes, even if the direction of change is unknown.
Reference construction. Consolidation produces well-defined highs and lows, which become common reference points for analysis. References do not instruct positions by themselves, but they structure how observers read price interaction.
Inventory dynamics. During balance, different classes of participants rebalance, hedge, or reduce risk. The footprint of those activities can be visible in the texture of price action, such as repeated tests or quick rejections, which adds nuance to interpretive work.
Chart Reading Cues without Prescribing Strategy
The following cues aid recognition and interpretation while avoiding prescriptive rules:
Respect the variability of shape. Not all consolidations are neat. A slightly sloped or irregular range can still be a valid pause if overlap and containment are present.
Note the interaction with boundaries. How price behaves at the edges of consolidation matters. Multiple swift rejections suggest abundant counterflow. Slow grinding into the edge with shallow pullbacks suggests an asymmetry in pressure even while the range holds.
Track the texture of volatility. Are bars shrinking steadily, or is the market alternating between large and small bars within the same range. Steady shrinkage points to persistent compression. Alternation can indicate active participation by both sides with localized bursts of initiative.
Monitor time and tests. More tests do not automatically strengthen or weaken a boundary. They simply record that price has visited the area often. The informational value lies in whether tests become more or less effective at pushing price away.
Consider the surrounding narrative. Consolidation cannot be divorced from the broader market story. Macro releases, sector rotation, and corporate events all influence why and how balance forms. The chart is the record of that interaction.
Extended Example: From Impulse to Balance to Expansion
To illustrate the interplay of context, consider a generic growth stock during a product launch cycle. In month one, positive guidance coincides with a price jump from 36 to 44 on heavy volume. In the next three weeks, price oscillates between 43.20 and 44.80. The daily candles are small, many are inside the prior day’s range, and several intraday attempts to push above 45 fail quickly. Average daily volume recedes from the spike but remains above the three-month average.
Here the consolidation serves several functions. It absorbs the initial excitement around guidance as different investor groups update their views. It allows early longs to reduce exposure and late buyers to enter at prices that feel closer to their assessment of value. The repeated failures above 45 do not necessarily imply a ceiling. They indicate that, at that time, liquidity above 45 was sufficient to absorb buying pressure.
In month two, a supply chain headline briefly knocks price to 42.80 intraday, a probe below the established floor. The move is quickly rejected, and price closes back inside the range. That failure to hold below the boundary says less about long-term direction and more about immediate order flow. Bids were available near the prior acceptance area. The consolidation persists until the next material information changes the balance.
Regardless of how the pattern eventually resolves, the analysis up to this point has already been useful. It clarified where the market found two-sided agreement, how aggressive initiatives were absorbed, and how sensitivity to headlines fed into short-term tests of the boundaries. These observations enhance understanding of the market’s current state without dictating action.
Applying Discipline to Visual Judgments
Because consolidation recognition begins with the eye, consistency benefits from a small set of rules of thumb that formalize the visual criteria. Without turning these into prescriptions, consider the following discipline for evaluation.
First, define a baseline window for comparison. For example, when reviewing a 30-minute chart, compare the height of the most recent twenty bars to the height of the previous twenty. If the ratio is meaningfully lower, a contraction is underway. Second, count how many closes fall within the prior bar’s range. A high proportion supports the interpretation of increased overlap. Third, record the number of distinct touches of the high and low of the candidate range. Multiple touches indicate that liquidity concentrated at those boundaries.
These steps produce a repeatable description of consolidation without implying a trading plan. They anchor the analysis in observable facts that can be revisited as new data arrives.
Practical Nuances Across Markets and Timeframes
Consolidation patterns differ in texture depending on the asset class and the timeframe.
Equities. Individual stocks often consolidate around earnings and corporate events. Overnight gaps can bracket the range and cause isolated probes that quickly revert during regular trading hours. Volume tends to be more informative in equities because corporate calendars drive participation.
Futures and indices. Index futures frequently develop intraday consolidations around schedule landmarks such as cash open and close. The distribution of liquidity across sessions creates recurring periods of balance. Triangles are common during midday as speculative participation falls and spreads dominate.
FX. Currency pairs often consolidate during regional session overlaps or during pre-event waiting. Because FX trades around the clock, consolidations can stretch across time zones and look irregular when viewed on a single-session chart.
Rates and credit. Fixed income markets can show extended, slow-motion consolidations where daily ranges compress gradually while policy expectations are digested. These consolidations may be sensitive to small shifts in macro data even if price movements remain orderly.
Cryptocurrency. Around-the-clock trading and varying liquidity across venues can create consolidations with frequent false breaks, especially during low participation hours. The pattern is still balance, but it is punctuated by sporadic runs driven by thin order books.
Combining Human Judgment with Simple Statistics
Many practitioners blend qualitative reading with simple statistics to reduce bias. A useful approach is to label consolidations visually, then test whether basic metrics agree. For instance, after marking a potential range on a daily chart, compute the realized volatility inside the range and compare it to volatility in the prior trend leg. If the inside estimate is significantly lower, the label has quantitative support. If not, reconsider the label. This process encourages humility and iteration, which are valuable in any analytical practice.
Concluding Perspective
Consolidation patterns capture essential aspects of market behavior: balance, liquidity aggregation, and the cyclical nature of volatility. They are not predictions packaged as shapes. They are records of how supply and demand have interacted over a defined period. When read with care, consolidations help organize thinking about the next phase of price discovery without asserting a specific outcome. They anchor analysis in where the market has accepted or rejected prices and in how the tempo of trading has shifted.
Key Takeaways
- Consolidation patterns are periods of containment, overlap, and volatility contraction that reflect temporary balance between buyers and sellers.
- Common visual forms include rectangles, triangles, and tight flags, but the underlying trait is the same: reduced net progress with repeated tests of nearby highs and lows.
- Analysts value consolidations for the clarity they provide about balance, reference points, and volatility regime shifts, not for built-in directional signals.
- Context matters. Duration, volatility ratios, participation, and higher timeframe alignment shape how a consolidation is interpreted.
- Quantitative cues such as overlap counts and range compression can support visual judgment, while awareness of limitations helps avoid overconfidence.