Introduction
The Relative Strength Index, or RSI, is one of the most widely used momentum oscillators in technical analysis. It condenses recent advances and declines in price into a bounded scale that runs from 0 to 100. Because it is normalized, RSI allows comparisons across securities and timeframes, and it offers a structured way to think about strength, weakness, and potential exhaustion in price movement. This article examines what RSI measures, how it is calculated, how it appears on charts, the types of behavior observers look for, and the practical context in which RSI information can be interpreted. It does not provide trading strategies or recommendations.
What RSI Is Measuring
RSI compares the magnitude of recent gains to the magnitude of recent losses over a specified lookback window. The most common setting uses 14 periods, which can be 14 days on a daily chart or 14 bars on an intraday chart. The indicator produces a value that approaches 100 when gains dominate recent price changes and approaches 0 when losses dominate. Values near the middle of the range imply a more balanced distribution of recent up and down closes.
The scale is important. Many technical indicators do not have a fixed upper or lower bound, which makes interpretation sensitive to the security’s own volatility and history. RSI remains within 0 to 100 by construction. This bounded nature encourages the use of reference levels, such as 70 and 30, that serve as heuristics for characterizing relatively stretched conditions in the recent price sequence.
How RSI Is Calculated
RSI is most commonly implemented using the method popularized by J. Welles Wilder. The calculation proceeds in two stages: first it computes average gains and average losses over the lookback period, then it transforms the ratio of those averages into the 0 to 100 scale.
The basic formula
Define RS as the ratio of the average gain to the average loss over the lookback period. RSI is then given by:
RSI = 100 − 100 ÷ (1 + RS)
When RS is large, meaning average gains exceed average losses, the denominator 1 + RS is large and the expression 100 ÷ (1 + RS) is small, so RSI moves toward 100. When RS is small, RSI moves toward 0. If gains and losses are equal on average, RS equals 1 and RSI equals 50. The 50 level is therefore a useful midpoint that corresponds to balanced positive and negative change.
Wilder’s smoothing
To compute the average gain and average loss, Wilder applied a smoothing technique that is similar in spirit to an exponential moving average. The first average is typically a simple average of gains and losses over the initial window. After that, each new average updates incrementally by combining the past average with the current gain or loss. This smoothing reduces abrupt jumps in RSI from bar to bar and produces a more stable oscillator.
Many software packages offer a variant sometimes called Cutler’s RSI, which uses simple averages for the entire series rather than Wilder’s smoothing. The resulting values are highly correlated but not identical, especially during volatile sequences. When comparing RSI values across platforms, it is important to verify the calculation method and the price source being used.
Price inputs and lookback choices
RSI is conventionally computed from closing prices. Some charting tools allow alternative inputs, such as typical price or median price. Changing the input slightly alters the sensitivity and the exact timing of peaks and troughs in the oscillator, although the structural interpretation remains similar. The lookback length controls responsiveness. Shorter settings, such as 7 or 9 periods, create a more reactive line that reaches extremes more often. Longer settings, such as 21 or 28 periods, smooth the signal and reduce the frequency of excursions into extreme zones.
How RSI Appears on Charts
On most platforms, RSI is displayed in a subpanel beneath price. It is drawn as a single line that oscillates between 0 and 100. Horizontal reference lines are commonly set at 70 and 30 to denote commonly used extreme zones. Another horizontal line at 50 marks the center. Some chart templates shade the region above 70 and below 30 to make high and low readings more visually distinct.
Because the indicator is bounded, any visual spikes are constrained to the same scale regardless of the symbol, which makes it easier to compare relative momentum states. Price itself continues to trend and can expand its range indefinitely. The RSI panel remains standardized, which is why many practitioners incorporate it when they want a perspective on the balance of recent advances and declines that is not distorted by absolute price level.
Why Observers Monitor RSI
RSI is observed for several reasons that relate to how trends and reversals often unfold in practice. None of these are guarantees or actionable directives. They are descriptive patterns that arise from the way the indicator summarizes recent price changes.
- It provides a compact momentum summary. A single number reflects the skew between recent up and down closes.
- It highlights potential exhaustion. When RSI climbs well above its usual range for a given market, it suggests that a run of positive closes has stretched conditions in the near term. The reverse is true for deeply depressed readings.
- It helps characterize regime. The oscillator’s tendency to hold above or below its midpoint can help label environments as momentum dominated or mean reverting.
- It is comparable across markets and timeframes because it is normalized.
Interpreting RSI in Context
Any single RSI reading gains meaning from its context. Observers typically consider the position of the oscillator relative to reference levels, the behavior around the midpoint, the pattern of peaks and troughs in the indicator compared with price, and the prevailing trend in the underlying market.
Overbought and oversold zones
The 70 and 30 levels are frequently used markers for relatively strong and relatively weak momentum. If RSI rises to 70 or above, it means average gains have recently dominated average losses. This can point to acceleration and strength in the underlying move. It can also indicate that a portion of the advance has already occurred and that the sequence of positive closes is statistically stretched over the chosen window. If RSI falls to 30 or below, the opposite conditions hold.
Two clarifications are essential. First, an overbought reading does not mean price must decline. Strong trends can keep RSI elevated for extended periods as the series of higher closes persists. Second, an oversold reading does not mean price must rally. Persistent weakness can maintain depressed RSI. The interpretation is therefore probabilistic in spirit and must be judged alongside price structure, volume, volatility, and timeframe.
The midpoint at 50
RSI equal to 50 corresponds to equal average gains and losses over the lookback. Observers use the 50 line to gauge momentum bias. Sustained holds above 50 are consistent with net positive pressure. Sustained holds below 50 are consistent with net negative pressure. In some conditions, RSI will cross 50 frequently, indicating a more balanced or choppy environment. The rate and persistence of excursions above or below 50 can help distinguish trending phases from consolidations.
Divergences between price and RSI
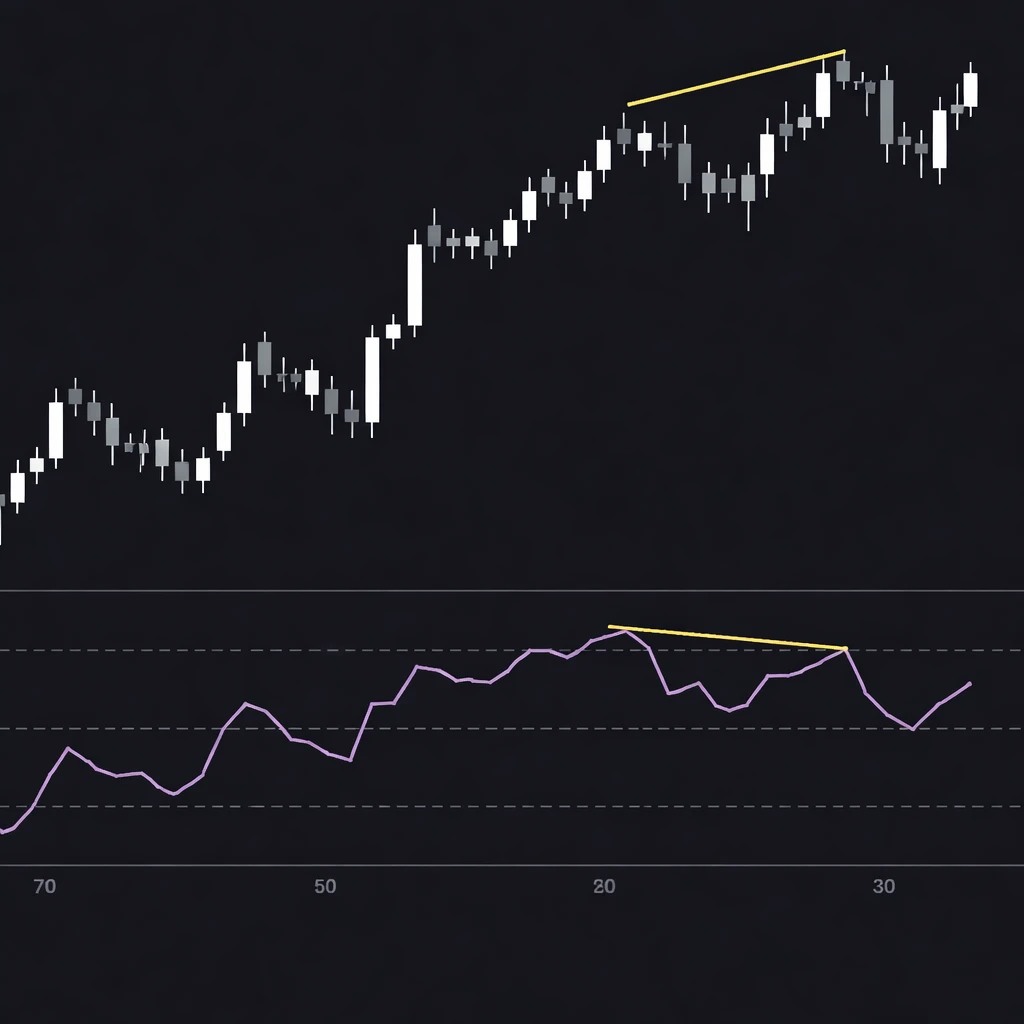
A divergence occurs when price and the oscillator move in different directions across corresponding swings. A common example is a higher high in price accompanied by a lower high in RSI, which is often described as a bearish divergence. The indicator suggests that the second price push did not carry the same momentum as the first. The mirror image, a lower low in price with a higher low in RSI, is often described as a bullish divergence.
Divergences flag potential momentum shifts. They do not specify timing or magnitude. They are more informative when the underlying market shows signs of slowing or when volatility is compressing. In strong trends, divergences can persist without a material change in the price path for many bars. The practical value of divergences depends on how they align with the broader chart context, including support or resistance zones, volume patterns, and whether the market is transitioning between regimes.
Range shifts during trends
RSI often displays what practitioners call a range shift during durable trends. In uptrends, the oscillator tends to form pullback lows at higher levels, for example finding support near the 40 to 50 region rather than falling to 30. Peaks may occur at 60 to 80 rather than at more extreme readings. In downtrends, the oscillator often finds rally highs near 50 to 60 and bottoms in the 20 to 40 zone. This shift reflects the underlying imbalance between average gains and losses during a trend.
Recognizing a range shift can help classify the prevailing environment. When RSI pullbacks consistently stop above 40 in an identified uptrend, it supports the view that momentum remains constructive. When rallies fail near 60 in an identified downtrend, it supports the view that momentum remains weak. These are descriptive signals, not entry or exit instructions, and they should be assessed together with price structure.
Parameter Choices, Variants, and Practical Details
Lookback length
The default 14-period setting offers a balance between responsiveness and smoothness for many charts. Shorter lengths produce a more choppy oscillator that will visit overbought and oversold zones more frequently. This can surface small fluctuations quickly but also increases noise. Longer lengths reduce noise at the cost of slower recognition of shifts in momentum. The appropriate choice depends on the timeframe being analyzed and the volatility of the underlying market.
Price source
Most RSI implementations use closing prices. Some users prefer typical price, defined as the average of high, low, and close, or median price, defined as the average of high and low. These alternatives aim to capture additional intrabar information. Differences in interpretation are usually incremental rather than fundamental.
Calculation methods
Wilder’s smoothing and Cutler’s simple averaging are the most common methods. Wilder’s approach emphasizes recent data slightly more, due to its recursive update formula, and often produces a subtly smoother line. For comparative analysis across tools or publications, it is useful to confirm which variant is being used and whether the lookback periods match.
Timeframes and aggregation
RSI can be applied to any timeframe. On intraday charts it reacts to short bursts of momentum and can swing rapidly. On daily, weekly, or monthly charts it can characterize longer momentum arcs and regime shifts. Because the indicator references a fixed number of bars, the meaning of a 14-period RSI differs between a 5-minute chart and a weekly chart. Aggregation effects matter. A weekly RSI reading integrates information across five daily bars, each of which is itself an aggregation of intraday behavior. Analysts typically align indicator settings with the horizon of their inquiry.
Limitations and Sources of Error
RSI summarizes recent changes using a fixed window. This has benefits for standardization, but it also imposes structural limitations. Several are important to keep in mind.
Regime dependence
RSI readings are influenced by the market environment. In range-bound conditions, the oscillator will often alternate between high and low zones as price swings between support and resistance. In trending conditions, RSI can remain elevated or depressed for extended periods. Interpreting a spike as exhaustion in a strong trend can be misleading. Likewise, expecting a sustained trend to emerge from a single oversold bounce in a range-bound market may be unrealistic.
Volatility effects
Because RSI measures the relative balance of up and down closes, it can be affected by volatility bursts and gaps. A cluster of outsized moves in one direction can quickly push the oscillator to an extreme. If volatility subsequently compresses without a decisive reversal, RSI may retreat from an extreme without any strong change in the trend. Without context, this can be mistaken for a signal that momentum has normalized in a way that implies a directional shift.
Indicator lag
Although RSI is responsive, it is still calculated from historical price changes. Peaks and troughs in the indicator often occur near, but not exactly at, important turning points in price. The smoothing that makes RSI readable also introduces lag. This is inherent to most moving-average based indicators and is not a defect so much as a characteristic that must be understood.
Parameter sensitivity
Small changes in lookback length or price source can alter the timing and magnitude of RSI moves. Analysts should avoid treating a specific configuration as uniquely authoritative. When the goal is to compare different assets or timeframes, documenting the settings and maintaining consistency improves interpretability.
Practical Chart-Based Examples
The following examples use hypothetical yet realistic price sequences to illustrate how RSI behavior can be interpreted on a chart. They are not suggestions to buy or sell any security.
Example 1: Strong advance with persistent high RSI
Suppose a stock rallies from 100 to 114 over 15 daily bars with only brief pauses. On a 14-day RSI, the indicator rises from 48 to 75 within the first week and then oscillates between 65 and 80 for the next eight sessions. Price continues to make higher highs and higher lows. The persistent hold above 60 in RSI indicates dominant positive closes across the window. Although the reading above 70 would be labeled overbought on many charts, the strong uptrend allows the oscillator to remain elevated. In this context, the overbought condition largely reflects the strength of the move rather than an imminent reversal.
Example 2: Range-bound market with alternating extremes
Consider an index that has moved sideways between 3,900 and 4,100 for two months. Each time price approaches the upper boundary, the 14-day RSI climbs into the 60 to 70 zone. Each time price approaches the lower boundary, RSI falls into the 30 to 40 zone. The oscillator alternates between these areas as the market oscillates within the range. In this environment, RSI extremes mostly signal that price has traveled from one side of the range toward the other within the recent window. They do not imply that the range will break.
Example 3: Divergence during a maturing advance
Assume a commodity futures contract rises from 72 to 78, pulls back to 75, then rises to 79 over several weeks. The first push to 78 produces an RSI peak at 73. The second push to a marginally higher high at 79 produces an RSI peak at 67, lower than before. Price has made a higher high, but the oscillator has made a lower high. That is a negative divergence. On the chart, this is often drawn by connecting the two price highs with an upward-sloping line and connecting the two RSI highs with a downward-sloping line in the subpanel. The divergence warns that the second push occurred with less relative momentum than the first. By itself, it does not specify what comes next. In practice, observers would weigh this information with the broader trend structure, any nearby resistance, and current volatility.
Example 4: Range shift during a downtrend
Imagine a currency pair that has been declining for two months. On rally days, RSI rises to the 50 to 55 region and then rolls over. On selloffs, RSI drops into the 25 to 35 region. This pattern repeats even as price continues to make lower lows and lower highs. The behavior reflects a range shift in the oscillator consistent with a downtrend. The fact that rallies fail to lift RSI above 60 suggests that positive closes are not dominating for long. As long as this pattern persists, the momentum profile remains weak.
Example 5: Midpoint dynamics and consolidation
Suppose a stock finishes a fast rally and then trades sideways for three weeks. During the rally, RSI stayed above 60. During the consolidation, the oscillator moves around 50 and crosses it repeatedly, fluctuating between 45 and 55. Price trades in a narrowing range. This behavior is consistent with a loss of directional momentum. It does not specify which way the next expansion will occur, but it contrasts clearly with the earlier phase in which RSI rarely dipped below 60.
Comparing RSI to Related Concepts
RSI belongs to the family of oscillators that quantify momentum. Stochastic oscillators compare the current close to the recent high-low range. Commodity Channel Index measures deviation from a moving average. Money Flow Index blends price and volume. Relative Strength Index distinguishes itself by focusing specifically on the balance of up and down closes, and by its standardized 0 to 100 scale. These differences produce distinct signatures on charts, even when all are attempting to capture momentum or exhaustion.
Integrating RSI with Broader Analysis
RSI is most informative when combined with a clear view of price structure. Chart features such as trend direction, support and resistance, and volatility regimes shape how the oscillator behaves. For example, during an established uptrend with well-defined higher lows, a pullback in RSI toward the 40 to 50 area may be typical and not alarming. During a prolonged range, repeated swings of RSI between 30 and 70 may be the norm. Volume analysis, time of day effects on intraday charts, and macro event calendars can also influence interpretation by affecting the pattern of gains and losses that feed into the indicator.
Risk management and position sizing are outside the scope of a technical indicator’s construction, yet they are relevant to how any indicator’s readings are applied in practice. RSI provides information about momentum and relative pressure. It does not measure risk, reward, or probability in a standalone manner. Treating RSI as one input among many is consistent with its design and with the way market data evolves across multiple horizons.
Common Misconceptions
Several misconceptions recur in discussions about RSI. Clarifying them helps avoid errors in interpretation.
- Overbought is not a synonym for sell. It identifies strong recent gains, not an imperative to fade them. Many sustained advances spend long stretches with RSI above 60 and frequent visits to 70 or higher.
- Oversold is not a synonym for buy. It identifies strong recent losses. Persistent downtrends regularly see RSI pinned near depressed levels.
- Divergence is not a timing tool by itself. It flags a shift in momentum relative to price swings. The path forward can still involve additional swings before any decisive change occurs.
- All timeframes are not interchangeable. An RSI reading on a 5-minute chart reflects a very different process than the same reading on a weekly chart. Conclusions should align with the timeframe of interest.
- Indicator settings are not universal. A 14-period RSI on one market may behave differently than on another due to volatility, liquidity, and typical trend structure.
Implementation Checks
When adding RSI to a chart or reviewing historical analysis, a few practical checks improve clarity. Confirm the calculation method, Wilder or Cutler. Verify the lookback length and the price input. Identify the placement of horizontal reference lines and whether shading influences perception of extremes. If comparing symbols or timeframes, maintain consistent settings or document differences. These steps help ensure that interpretations flow from the same underlying construction rather than from hidden defaults.
Closing Perspective
RSI distills the tug-of-war between buying and selling pressure into a single, bounded series that is easy to read on a chart. Its value lies in how it structures observation. Overbought and oversold zones highlight momentum extremes. The midpoint gauges bias. Divergences and range shifts add nuance about how trends mature or stall. None of these features predict outcomes. They help frame questions about the state of price behavior, the durability of recent moves, and the shifting balance of short-term forces across different market regimes.
Key Takeaways
- RSI measures the balance of recent gains and losses on a fixed 0 to 100 scale using a specified lookback window.
- Common reference levels at 70, 50, and 30 help characterize momentum as stretched, neutral, or weak, but they do not prescribe trades.
- Divergences, midpoint behavior, and range shifts provide context about momentum changes relative to price swings and trend conditions.
- Settings and calculation variants affect sensitivity and timing, so consistency and documentation matter when interpreting readings.
- RSI is most useful as a structured lens on momentum when combined with broader chart analysis rather than used in isolation.