Indicators & Oscillators

Common technical indicators such as moving averages, RSI, MACD, and momentum tools.

Part of Technical Analysis

What you will learn

This scope is designed to help you build a practical understanding of Indicators & Oscillators. Lessons move from core definitions to real-world context and common failure points.

Lessons

Reading in order is recommended, but each lesson stands on its own.

14 min read
Intermediate

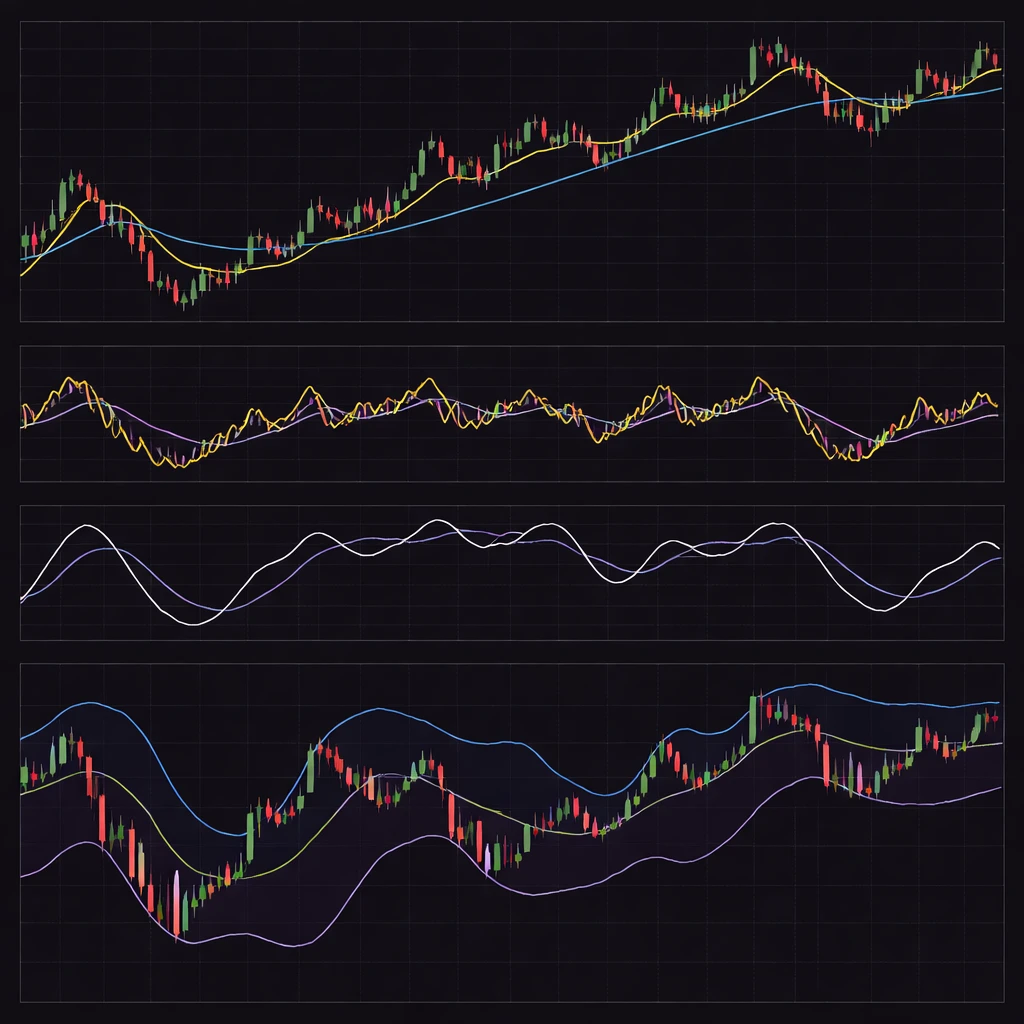
Indicator Settings and Pitfalls

A rigorous overview of how indicator settings shape what you see on price charts, why parameter choices matter, and the common pitfalls that distort interpretation when using technical indicators and oscillators. Emphasis on chart behavior, sensitivity, and practical context without strategy advice.

10 min read
Intermediate

Too Many Indicators Problem

The Too Many Indicators Problem describes how stacking numerous technical tools on a chart can obscure price behavior, create redundant or conflicting signals, and increase cognitive load. This article defines the concept, shows how it appears on charts, explains why it matters, and provides practical, chart-based context for clearer interpretation…

12 min read
Intermediate

Why Indicators Lag

An in-depth explanation of why technical indicators and oscillators react after price has moved, how this delay appears on charts, and how understanding lag helps interpret market behavior without assuming predictive power. This article focuses on the mechanics of smoothing, lookback windows, and timing conventions that create indicator lag.

10 min read
Beginner

Indicators vs Price Action

A clear, academic explanation of how indicators and oscillators relate to raw price action, what each presents on a chart, and why the distinction matters for interpreting market behavior without proposing trades or setups. Includes practical, chart-based context.

12 min read
Intermediate

When Indicators Fail

A rigorous explanation of what it means when technical indicators fail, how these failures appear on charts, and why they matter for interpreting price behavior across market regimes and time frames. Includes practical chart-based contexts and diagnostic considerations without trade recommendations.