Analysts frequently describe markets as overbought or oversold when prices appear stretched relative to recent behavior. These labels refer to statistical and behavioral conditions rather than intrinsic value. In practice, the terms describe a state in which price momentum has carried far enough that a counter-move, pause, or deceleration becomes more probable than it was before. Crucially, overbought does not mean a decline must follow, and oversold does not guarantee a rebound. The concepts help contextualize price behavior by quantifying how far and how fast prices have moved compared with their own recent history.
Defining Overbought and Oversold
Overbought and oversold are relative assessments. They measure the degree of extension in price movements over a chosen window of time. The measurement is usually carried out with oscillators or band-based tools that compare current price action to a rolling benchmark. Because the benchmark is anchored to recent data, the assessment adapts to shifting volatility and trend conditions.
Overbought describes a state where upward price movement has been unusually strong or persistent compared to recent norms. The label highlights momentum strength and potential exhaustion risk. Oversold is the corresponding state on the downside, indicating unusually strong or persistent negative momentum. Both terms are agnostic to fundamental valuation. They summarize recent path and speed of prices, not whether the asset is expensive or cheap on intrinsic grounds.
Price Extension vs. Valuation
It is useful to separate the ideas of technical extension from economic value. Overbought conditions do not assert that an asset is overpriced relative to cash flows or balance sheet metrics. They indicate that the recent buying pressure has dominated to an unusual degree. Likewise, oversold signals intense recent selling pressure. The interpretation is probabilistic and conditioned on market microstructure, not on long term value estimates.
Oscillators as Measurement Devices
Oscillators transform price changes into bounded or quasi-bounded series that highlight extremes. A bounded oscillator has a fixed range, such as 0 to 100, which helps define consistent thresholds for what counts as extreme. Unbounded or band-based tools use standardized distances from a mean or a moving average to judge extension. The goal in both cases is to convert raw price action into a scale where atypical moves stand out.
How Overbought and Oversold Appear on Charts
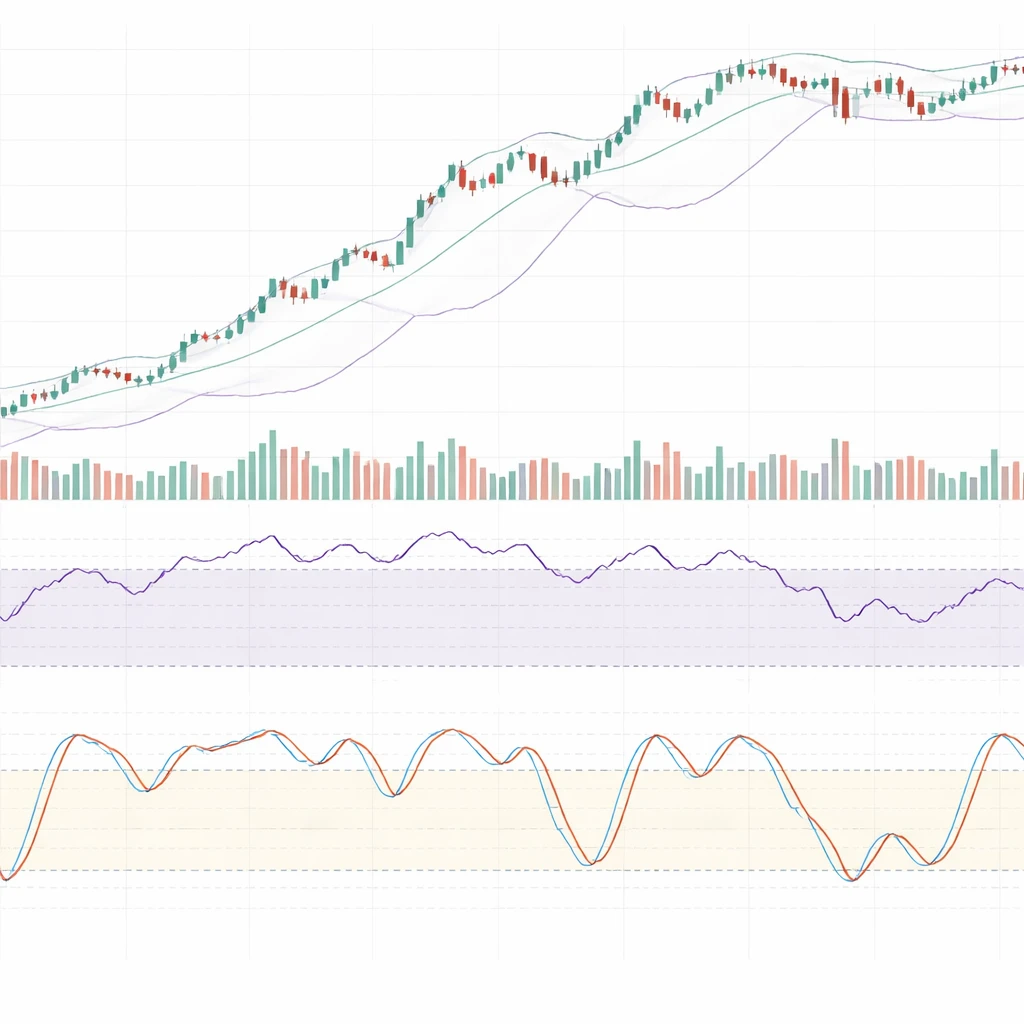
On a chart, overbought and oversold typically appear as oscillator readings that cross into upper or lower zones or as price touching or pushing beyond bands. The visual cues are designed to be quick to identify and consistent across instruments and timeframes, subject to parameter choices.
Bounded Oscillators
Several popular oscillators operate within a fixed range and present horizontal reference lines that denote potential extremes:
- Relative Strength Index (RSI) is scaled from 0 to 100. Upper readings are often interpreted as momentum strength, while lower readings indicate momentum weakness. Analysts commonly draw horizontal lines to demarcate zones where readings are historically unusual for the selected lookback period.
- Stochastic Oscillator compares closing prices to the recent high-low range and is also bounded between 0 and 100. High values reflect closes near the top of the range, and low values the opposite.
- Williams %R measures the position of the close relative to the recent high-low range, scaled from 0 to negative 100. Values near zero indicate proximity to recent highs, and values near negative 100 indicate proximity to recent lows.
- Money Flow Index (MFI) incorporates both price and volume to estimate buying and selling pressure over a lookback window. Like RSI, it is bounded between 0 and 100 but is constructed with volume-weighted price moves.
On these oscillators, upper-zone readings are commonly described as overbought and lower-zone readings as oversold. The position within the band is only one piece of information. The slope and persistence of the oscillator also matter for interpretation.
Unbounded and Band-Based Measures
Other tools do not use fixed bounds but still identify extension:
- Commodity Channel Index (CCI) expresses price relative to a moving average with a volatility adjustment. It oscillates around zero and flags relatively large deviations, up or down.
- Moving average envelopes or Bollinger Bands frame price relative to a moving average and a volatility estimate. When price closes near or beyond an outer band, it may be considered extended relative to the recent distribution of returns.
- Z-scores of distance from a moving average offer a standardized way to quantify how far price has moved from a mean in units of its recent standard deviation.
With these tools, overbought corresponds to positive deviations that are large relative to recent volatility, and oversold to large negative deviations. Since they are not capped at a fixed upper value, readings can become more extreme as trend intensity and volatility increase.
Thresholds and Parameters
Thresholds are conventions. For bounded oscillators, many charting platforms plot default lines that users associate with extremes. For unbounded tools, extreme levels are often defined in terms of standard deviations or typical historical ranges. The lookback length and smoothing method influence how often readings enter extreme zones and how long they remain there. Short lookbacks are more sensitive and may reach extremes quickly. Longer lookbacks smooth noise but can lag developing moves.
Why Analysts Pay Attention to Overbought and Oversold
Analysts focus on these conditions for their descriptive content and for how they can structure the discussion of potential risk. The primary motivations are informational, statistical, and behavioral.
Informational Content
Extreme oscillator readings convey that one side of the market has dominated over the measurement window. That information can be used to contextualize risk of exhaustion or the potential for either a counter-move or a consolidation. In calm environments, extremes can be rare, which makes them noteworthy when they occur. In volatile environments, extremes arrive more frequently and are less distinctive without additional context.
Behavioral and Microstructure Considerations
Order flow often clusters. Momentum can build as traders chase prices higher or lower, and liquidity can thin near new highs or lows, producing faster moves. Overbought and oversold readings often reflect these dynamics. At the same time, if participants who missed the initial move step in on shallow setbacks, strong trends can keep oscillators pinned near extremes. The persistence of an extreme can be as informative as the initial entry into the zone.
Trend vs. Range Regimes
In a trending regime, overbought readings often correspond to a market that is advancing efficiently, while oversold readings often capture pullbacks within the downtrend. In a range regime, oscillators may swing repeatedly between upper and lower thresholds as price travels between support and resistance. The same absolute reading can carry different implications depending on the broader regime, which is why context matters.
Practical Chart-Based Contexts
Charts provide the most intuitive view of extension. The examples below illustrate how extremes can appear and evolve without implying any recommended action.
Persistent Strength in an Uptrend
Consider a daily chart of an equity index that has climbed for several weeks with shallow pullbacks. An RSI with a moderate lookback spends extended time in its upper zone while price makes a series of higher highs and higher lows. The oscillator occasionally dips slightly, then quickly returns to high readings. Price may consolidate sideways while the oscillator declines toward its midpoint, a phenomenon sometimes called a momentum reset. In this situation, the market neutralizes the extreme not only through price decline, but also through time and range contraction. The key observation is that overbought conditions can resolve by stalling or slowing the advance rather than reversing it.
Range-Bound Oscillation
Now consider a currency pair fluctuating within a well-defined horizontal range. A Stochastic Oscillator alternates between high and low zones as price travels from the upper boundary to the lower boundary and back. The overbought and oversold labels here largely describe where price sits within the range relative to recent highs and lows. The readings may change direction frequently and quickly, underscoring that extremes in a range can be shorter-lived than in trending conditions.
Divergences as a Qualitative Signal
A divergence occurs when price makes a new high or low, but an oscillator fails to confirm with a corresponding extreme. For example, price may notch a marginal new high while the RSI records a slightly lower high than on the prior swing. Analysts sometimes view that pattern as a sign of diminishing momentum. Divergences can persist across several swings and are not timing signals on their own. They highlight a change in the texture of the move, suggesting that the momentum behind price extension is weakening relative to earlier conditions.
Volume-Sensitive Extremes
Volume-adjusted oscillators such as the Money Flow Index incorporate trading volume into their calculations. Imagine a stock that breaks above a several-month range with a surge in volume. The MFI may jump into its upper zone immediately. That combination indicates both strong price movement and heavy participation. Later, if price consolidates and volume recedes, the MFI may retreat toward neutral even if price remains elevated, because the volume component is no longer reinforcing the extension. This illustrates how the construction of an oscillator influences its behavior around extremes.
Interpreting Readings with Context
Extreme readings gain meaning when placed in a broader analytical frame. The following considerations help describe the context in which extension occurs.
Timeframe Dependence and Alignment
Extension is partly a function of the measurement window. A five-minute chart can be overbought while a daily chart is neutral or even oversold. Conflicting signals across timeframes are common, since each timeframe reflects a different subset of order flow and participant behavior. Many analysts reconcile this by prioritizing the timeframe that aligns with their analytical horizon, then using other timeframes to understand near-term noise or long-term trend position.
Volatility Regime and Normalization
Volatility conditions shape how easily oscillators reach extremes. During low-volatility periods, even modest directional moves can push bounded oscillators into their upper or lower zones. During high-volatility periods, extreme readings are more frequent and can persist longer. Standardizing deviations by recent volatility, as with bands or z-scores, can mitigate regime shifts but cannot eliminate them. Analysts often re-examine parameter choices when regimes change to maintain a useful balance between sensitivity and stability.
Market Structure and Nearby Levels
Structure refers to the recognizable features of the price path, such as prior swing highs and lows, gaps, and moving average slopes. When overbought conditions occur near well-watched reference points, such as a prior high, analysts may infer that the result of the extension will depend on whether price accepts above that level or rejects it. When oversold readings appear near prior lows, the same logic applies. The overbought or oversold label provides the intensity measure, while structure provides the location.
Reset Dynamics
Oscillators often move back from extremes faster than price retraces. A market can work off an overbought state by drifting sideways, showing alternating small candles and low volume. The oscillator descends toward its midpoint as the calculation window rolls forward and older strong readings fall out of the sample. The opposite occurs for oversold states. This reset behavior explains why extremes need not imply a reversal. Resolution can arrive through time and compression rather than through price change.
Construction Details of Common Tools
Each oscillator embeds choices about lookback length, smoothing, and normalization. Understanding the construction clarifies why readings behave differently across tools.
Relative Strength Index
RSI compares the magnitude of recent gains to recent losses across a lookback window and maps the result to a 0 to 100 scale using a smoothing process. The ratio of average gains to average losses drives the value. During strong advances, average gains outweigh average losses and push the index higher. The smoothing component reduces noise but also introduces lag, which can cause the indicator to remain elevated or depressed as strong moves persist.
Stochastic Oscillator
The Stochastic Oscillator evaluates the closing price relative to the recent high-low range. Values near 100 imply closes near the top of the range, and values near 0 imply closes near the bottom. Because it focuses on position within the range instead of net up or down change, it often responds quickly to price flipping between intraday extremes. Many chartists plot both a fast and a smoothed version to manage sensitivity.
Commodity Channel Index
CCI measures how far price deviates from a moving average, scaled by a mean absolute deviation or similar volatility measure. The series oscillates around zero and becomes positive or negative as price rises above or falls below its average by larger amounts. Since it is unbounded, extremely strong trends can drive unusually high or low values that persist until the trend weakens or volatility expands further.
Williams %R and Money Flow Index
Williams %R mirrors the Stochastic concept but uses a negative scale, with readings near zero indicating price near recent highs. The Money Flow Index incorporates volume by weighting price changes by traded value, then processing that information through a construction similar to RSI. Accordingly, the MFI tends to be most informative when volume behaves very differently from its recent pattern.
Limitations and Common Misconceptions
Overbought and oversold concepts are widely used, which makes it important to understand their limitations and avoid common misinterpretations.
Overbought Is Not a Synonym for Imminent Decline
Strong uptrends can keep bounded oscillators pinned to upper zones for extended periods, and unbounded tools can register sustained positive deviations. The condition primarily signals that the market has moved far and fast relative to its recent baseline. Whether that resolves with a pause, a pullback, or a continuation depends on broader conditions and incoming information.
Parameter Sensitivity
Different lookback lengths and smoothing choices can change both the frequency and the intensity of extremes. Shorter settings increase responsiveness but may degrade reliability by reacting to noise. Longer settings reduce false extremes at the cost of lag. Comparing results across parameterizations can help determine whether an observed extreme is robust or highly sensitive to a specific configuration.
Instrument Characteristics
Some instruments trend more persistently than others. Growth-oriented equities can show extended periods of positive drift, while mean-reverting currency pairs may oscillate between extremes more often in narrow ranges. The same threshold can imply different typical outcomes across instruments. Analysts often account for this by calibrating thresholds or using standardized measures of deviation.
Data Quality and Gaps
Corporate actions, roll adjustments in futures, and illiquid trading hours can introduce discontinuities that distort oscillators, especially those sensitive to intraday highs and lows. Outliers can push band-based measures outward temporarily. Cleaning and adjusting data appropriately helps maintain consistency in the interpretation of extremes.
Post Hoc Storytelling Risk
It is easy to point to an extreme after a reversal and claim it was a warning sign. The challenge is that many extremes do not lead to immediate reversals, particularly in strong trends. A disciplined process for evaluating the historical behavior of a chosen indicator on a chosen instrument and timeframe reduces the risk of selective memory and overconfidence.
Working with Overbought and Oversold in Practice
Although overbought and oversold readings are straightforward to identify, their interpretation benefits from a structured approach that avoids implicit assumptions.
- Define the objective clearly. An analyst should specify whether the aim is to characterize short-term momentum, identify potential exhaustion, or compare instruments by standardized deviation. The same tool can serve different objectives with different parameter choices.
- Document parameter choices. Recording lookback lengths, smoothing methods, and threshold levels promotes consistency over time and helps explain changes in behavior when volatility regimes shift.
- Assess regime and structure. Placing extremes within the context of trending or ranging conditions, as well as nearby structural features, provides essential explanatory power beyond the raw reading.
- Use multiple perspectives prudently. Cross-referencing bounded oscillators with volatility-standardized measures can help distinguish fleeting noise from meaningful extension, while avoiding overfitting by adding too many simultaneous filters.
- Evaluate persistence. The duration of an extreme can be as important as the level. A brief spike may reflect a single news-driven candle. A multi-session extreme suggests sustained order flow dominance.
Extended Examples and Nuances
Several nuances help clarify how extremes develop and resolve across different market backdrops.
Breakouts and Re-Centering
When price breaks from a consolidation, oscillators often register an immediate extreme because the calculation window is filled with small candles followed by a sudden large move. If the breakout holds, the indicator may remain elevated while price forms a new range at higher levels. Over time, the oscillator re-centers as the lookback window replaces pre-breakout data with post-breakout data. This behavior reflects an important point. Extremes can represent a successful transition to a new equilibrium rather than an unsustainable surge.
False Extremes in Volatile Noise
In choppy conditions with high intraday volatility and no directional bias, oscillators may swing rapidly into extreme zones without price making meaningful progress. The chart often shows overlapping candles, broad intraday ranges, and frequent tests of both highs and lows. Here, extremes mostly record turbulence. Analysts sometimes mitigate this by smoothing inputs, lengthening lookbacks, or using volatility filters to avoid isolated spikes.
Interaction with Moving Averages
Distance from a moving average is a practical proxy for extension. A price that trades several volatility units above a rising average is extended, but that assessment depends on both the slope of the average and the volatility setting. During strong trends, the moving average itself can catch up to price quickly, converting an apparent extension into a neutral state without much adverse movement. This dynamic ties back to the reset concept discussed earlier.
Event-Driven Moves
Earnings releases, macroeconomic data, and policy announcements can generate gaps and surges that push indicators into extremes instantaneously. Event-driven extremes should be understood alongside the nature of the event, liquidity conditions, and the presence of follow-through in subsequent sessions. The initial extreme often tells more about the shock than about the ongoing state of the trend.
Putting It All Together
Overbought and oversold concepts are simple to state and widely seen on charts, yet their interpretation is nuanced. The measurements indicate how far and how quickly price has deviated from its recent baseline. They are most informative when combined with knowledge of volatility regime, trend or range context, structural reference points, and the construction details of the chosen tool. Used in this way, the concepts help frame discussions of risk, momentum, and potential exhaustion without asserting that a particular price path will follow.
Key Takeaways
- Overbought and oversold are relative measures of recent price extension, not statements about intrinsic value.
- Oscillators and bands translate raw price action into standardized scales where extremes are easier to identify.
- The same extreme reading can imply different risks and possibilities in trending versus ranging regimes.
- Extremes can resolve through time and consolidation as well as through outright reversal.
- Interpretation improves when readings are combined with volatility regime, market structure, and clear documentation of parameters.