Technical analysis often divides into two complementary perspectives: what the price itself is doing, and what calculated indicators and oscillators infer from that price. Understanding the distinction between these two perspectives, and the way they interact on a chart, can clarify what information is primary and what is derived. That clarity helps a trader interpret market behavior without overstating what indicators can or cannot tell us about the future.
Defining Price Action and Indicators
Price action refers to the direct observation of price movement as plotted on the chart. It includes candles or bars, gaps, highs and lows, swing structure, and the tempo of movement. Price action can also include the study of ranges, breakouts, and the relationship among open, high, low, and close. It is the raw, unprocessed record of transactions.
Indicators and oscillators are mathematical transformations of that same price record, sometimes combined with volume. A moving average smooths a series of closes. An oscillator like the Relative Strength Index rescales recent gains and losses into a bounded number line. A volatility measure such as Average True Range consolidates the magnitude of recent movement into a single series. Indicators transform price history into alternative coordinates that can be easier to read, quantify, or compare across markets and timeframes.
The contrast is straightforward. Price action is the primary source. Indicators are derived views that can highlight tendencies that may be difficult to perceive from raw bars alone.
How the Concept Appears on Charts
On most charting platforms, price action is the candle or bar plot. Indicators appear in two common placements.
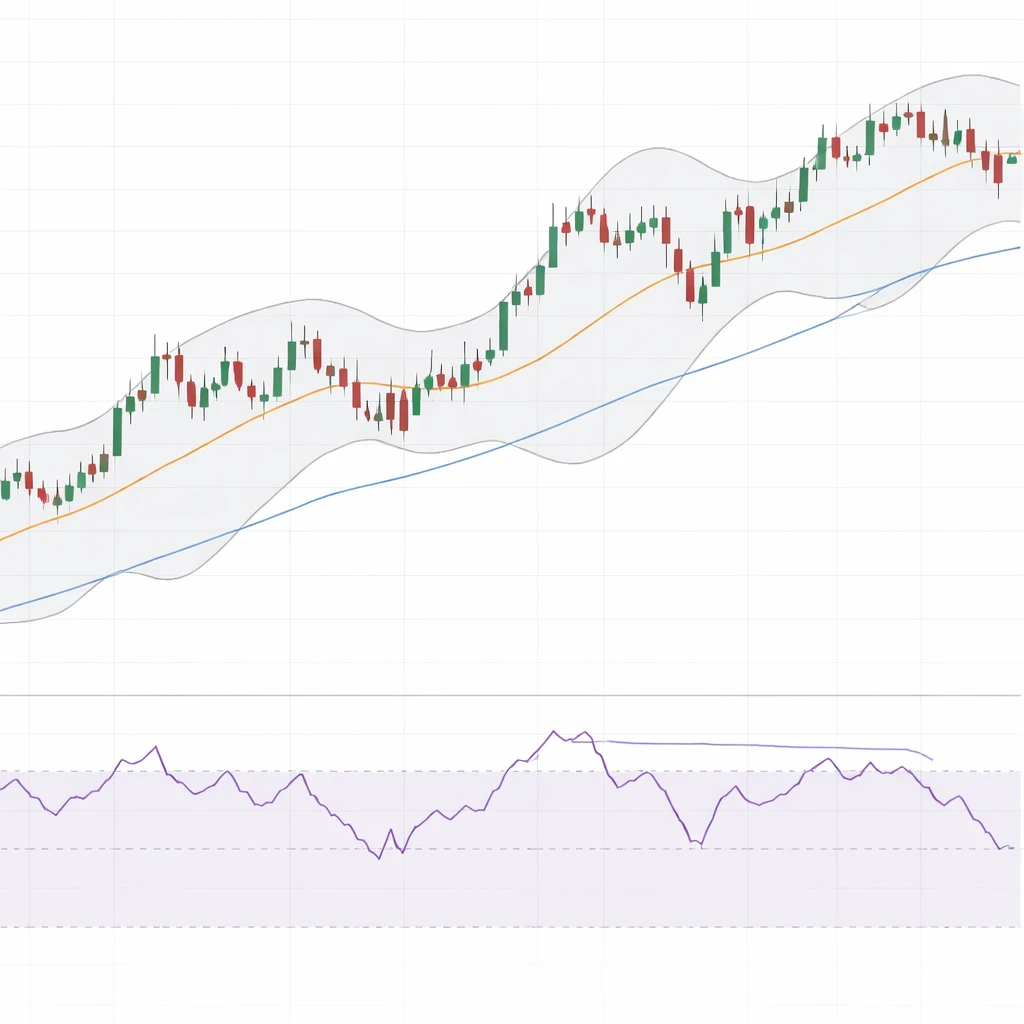
Overlays on price sit on top of the candle plot. Typical overlays include simple or exponential moving averages, Bollinger Bands that widen and contract with volatility, or anchored VWAPs drawn from a specific date. These overlays translate information such as trend direction or dispersion and present it in the same vertical scale as price, making visual comparison straightforward.
Separate panels below price house oscillators and other transforms that require their own vertical scales. Relative Strength Index, Stochastic, and MACD often occupy a sub-panel. The panel separation makes it visually clear that these values are not prices but functions of price history, sometimes normalized to fixed ranges such as 0 to 100.
On the same chart, these two visual domains interact. The top pane shows the path of the market itself. The lower pane or overlays show a filtered or re-expressed version of that path. Reading the chart involves learning what each representation emphasizes and what it suppresses.
Why Traders Pay Attention to the Distinction
Traders pay attention to indicators versus price action because the two sources answer different questions.
Price action answers the question: what happened and in what sequence. It reveals the structure of swings, the presence of gaps, the timing of pushes and pauses, and the exact location of higher highs or lower lows. It contains the fullest narrative content but can be noisy. Short bursts of volatility may obscure the broader context.
Indicators answer the question: how can the same history be summarized, smoothed, or normalized. Smoothing can make trend persistence or fading momentum easier to see. Normalization can help compare movement across instruments that have different price levels. These benefits arrive with trade-offs. Smoothing introduces lag relative to price. Normalization can overemphasize small fluctuations in quiet regimes or compress intense movement in turbulent regimes.
The distinction matters because it highlights the roles of primary and derivative information. Raw price records new facts at every tick. Indicators translate those facts into signals about trend, momentum, volatility, or relative position within a recent window. Many errors in interpretation occur when the translation is mistaken for new information rather than a restatement of the same underlying prices.
What Indicators and Oscillators Actually Measure
Different indicators emphasize different features of the price record.
Trend filters such as simple and exponential moving averages reduce the variance of price by averaging prior closes. They respond more slowly than price and are meant to capture directionality across a chosen window length. The price may whipsaw above and below short moving averages in a range, while long moving averages may continue drifting in the direction set by earlier movement.
Dispersion bands such as Bollinger Bands translate volatility into visible boundaries around a central average. During contraction, the bands narrow around price, and during expansion, they widen. Bands can highlight when price is near a recent extreme without claiming that reversion will follow.
Momentum oscillators like RSI or Stochastic re-express recent gains and losses in a bounded scale. These readings tend to travel in cycles and can remain in elevated or depressed zones for extended periods when price trends persist. Short windows react quickly but are sensitive to noise. Longer windows react slowly but have fewer swings.
Rate-of-change and MACD-style measures compare faster and slower components of price movement. A crossover or histogram expansion often means the faster component has moved away from the slower component, which is another way of describing a change in momentum.
Volatility measures such as Average True Range summarize the typical range of price movement over a window. ATR is not directional. It relates to the magnitude of movement, which can rise in either uptrends or downtrends.
How Price Action Encodes Information
Price action is read through structure and context. A sequence of higher highs and higher lows tells one story. Repeated rejection at a horizontal area tells another. Long real bodies in candles indicate directional conviction, while small bodies with long wicks indicate indecision or contest between buyers and sellers. None of these elements are predictive by themselves. They are descriptive tools that identify where energy has concentrated or stalled.
Unlike indicators, price action carries timing cues that are not averaged away. For example, three quick pushes higher in a short window indicate acceleration on a raw chart even before any moving average turns up. The trade-off is that raw price may exhibit frequent noise spikes that obscure the bigger picture. There is no mathematical guarantee that a newly formed high or low will persist or reverse. The observation simply records that it occurred.
Information, Lag, and Noise
Indicators reduce noise by aggregating data, which improves readability at the expense of timeliness. The lag is mechanical. A 20-period moving average cannot fully reflect a sharp move that began only two bars ago. Oscillators that depend on relative gains and losses can shift direction before or after a visible inflection in price depending on the window length and the recent path. Price action does not lag because it is the current print. It may, however, contain more false starts when viewed at a fine resolution.
Thinking in terms of variance and bias can be helpful. Smoothing reduces variance in the signal shown on the chart, which increases the chance of missing rapid changes. No smoothing leaves variance high, which increases the chance of reacting to noise. Neither approach is right or wrong. Each approach discloses and conceals different aspects of the same market history.
Practical Chart-Based Context
It is useful to imagine specific, concrete chart views to see how indicators and price action interact without proposing any trade decisions.
Example 1: A persistent uptrend with shallow pullbacks
Suppose a daily chart shows a steady series of higher highs and higher lows. Price candles are mostly above a 50-day moving average that slopes upward. When pullbacks occur, they are brief and do not travel far below recent swing lows. The moving average smooths out the choppiness between swings, helping the viewer see the ongoing direction even if a few candles are red. The price action shows the exact structure, including where buyers were able to lift the market after each pause. The indicator and the price are telling the same story, with different levels of granularity.
In this environment, an oscillator like RSI may spend extended time in elevated territory. That behavior is not unusual in persistent trends. The oscillator annotates the idea that momentum remained strong relative to the chosen window, while the candles confirm that new highs continued to be printed.
Example 2: A wide range with recurrent mean reversion
Consider a market that oscillates between two horizontal areas over several weeks. Price repeatedly approaches the upper boundary and then falls back toward the mid-range. A moving average with a length similar to the range cycle may flatten and overlap price frequently. On the candles, the range structure is evident through repeated failures to close beyond the boundary. An oscillator may swing from high to low across its bounded scale more frequently, reflecting the alternating dominance of gains and losses in the lookback window.
Here, the indicator is translating the same story as the bars. The moving average conveys lack of trend through its flatness. The oscillator confirms frequent shifts in near-term momentum. The price action shows the exact boundaries and failed attempts to break free. The chart communicates rotational behavior in both raw and transformed forms.
Example 3: Divergence between oscillator and price
Now imagine price makes a fresh marginal high relative to a prior swing, but a momentum oscillator prints a lower high. This is a divergence in indicator terms, and it is visible only because the oscillator rescales recent gains and losses. Price action, by contrast, registers a new high and thereby confirms that buyers were able to press beyond the prior peak. Both facts are simultaneously true. The divergence conveys a change in the character of the advance as measured by the oscillator, while the new high in price documents that the advance continued. Interpretation requires context such as trend age, volatility, and the size of the marginal new high, not a single reading in isolation.
When Indicators and Price Action Disagree
Disagreement is common and often instructive. A few patterns of conflict appear regularly on charts.
First, price can break a recent swing high while a slower moving average has not turned up yet. That does not mean the average is wrong. It means the chosen window has not yet digested the new data. The lag is observable and expected. Second, oscillators may exit an extreme zone while price continues in the same direction. That often reflects a shift from fast acceleration to a steadier pace rather than a reversal. Third, in very low volatility, small price moves can produce large percentage changes in some normalized indicators, exaggerating the signal relative to the visual impression from candles.
When conflict occurs, it is useful to recall that all indicators are functions of price. The disagreement is a matter of transformation and timing, not a clash between independent sources of truth. The chart reader can evaluate which representation is most informative for the current question. Identifying the question is critical. Is the focus on whether the market has established a new structural high or low, or on whether momentum is fading within the current leg, or on how dispersed recent movement has been.
Information Overlap and Redundancy
Because many indicators are variations on smoothing, differencing, or normalization, they frequently overlap in content. Two momentum oscillators often respond to the same patterns with slightly different timing. Combining several similar indicators can create a false sense of diversified input while adding little new information. The same applies to multiple moving averages with adjacent lengths. On charts with too many studies, it becomes difficult to isolate what is genuinely new when the indicators change.
A practical chart layout typically separates roles. One or two overlays for trend and dispersion, one oscillator for momentum, and a clean price panel can provide a balanced view. Adding more studies tends to increase visual noise without improving the underlying signal. The guideline is informational diversity rather than study count.
Timeframe and Scaling Considerations
Timeframe changes the apparent relationship between indicators and price action. Short intraday charts produce many more minor swings and therefore drive more frequent indicator shifts. Daily or weekly charts compress noise and make indicator changes rarer. A moving average that behaves smoothly on a daily chart may whip around wildly on a 1-minute chart. Likewise, an oscillator that seldom visits its extreme zones on a weekly chart may remain near extremes for long stretches on a daily chart during persistent trends.
Scaling choices matter as well. Logarithmic price scales proportionally compress large price levels, which can affect the visual slope of overlays. Indicator values that depend on percentage changes may align more intuitively with log price scales. None of these choices change the underlying math but they do change what the eye perceives, and perception often leads interpretation.
Normalization, Thresholds, and Context
Banded oscillators with fixed thresholds are attractive because they offer clear reference levels. Thresholds are not universal truths. They are rules of thumb that assume a particular range of volatility and trend behavior. In quiet uptrends, an oscillator may rarely dip into its lower band, just as in turbulent ranges it may cross bands repeatedly. Treating thresholds as context-sensitive rather than absolute improves interpretation. The bands help locate where current momentum sits relative to recent history, not where price must move next.
Trend filters have context too. A rising moving average confirms that average prices over the chosen window have been rising. The slope is an arithmetic consequence. If the window length is mismatched to the rhythm of the market, the reading may be either too jumpy or too slow. This is a parameter choice issue rather than a shortcoming of the concept.
Myths and Realities About Indicators vs Price Action
A few misconceptions frequently appear in discussions.
It is sometimes claimed that indicators predict while price merely reacts. In fact, indicators are transformations of past price and cannot create information from the future. They can, however, present a history that reveals tendencies more cleanly than raw bars. It is also claimed that price action is purely objective while indicators are arbitrary. Price action still requires judgment about which swings matter, what constitutes a meaningful break, and how to treat gaps or outliers. Indicators require parameters and assumptions, but they often provide consistent rules once those choices are made.
Another myth is that divergences or crossovers must lead to specific outcomes. Outcomes vary by context. Divergences occur frequently in extended trends without immediate reversal. Crossovers cluster during choppy periods. The indicator constructs are descriptive of changes in rate or dispersion. They do not obligate the market to respond in any particular way.
Data Quality and Market Structure Considerations
The way indicators and price action behave also depends on data quality and market structure. Overnight gaps on equities alter moving averages differently than continuous futures streams. Illiquid assets with sporadic prints can trigger spurious oscillator swings. Crypto markets that trade continuously without closing auctions produce different rhythm and gap patterns from exchange-traded equities. If volume is included in any indicator, the story changes again because volume has its own microstructure rules. All of these elements shape how faithfully the indicator mirrors the underlying reality.
Putting the Perspectives Together on a Single Chart
Combining price action with a few indicators is fundamentally a communication design problem. The chart is a visual instrument that highlights certain features. Clean candles or bars show structural truth. A well-chosen moving average displays the central tendency of price over a recent window. A single oscillator in a lower panel shows shifts in momentum without crowding the price pane. Colors and line thickness can be selected to ensure that price remains primary and that derived lines are supportive context rather than focal points.
One instructive exercise is to toggle indicators off and on. With only candles visible, identify swing highs and lows and note whether they are rising or falling. Then add a moving average and see how its slope compares to the swing structure. Next, show an oscillator and watch how its cycles align with pullbacks or accelerations. The exercise highlights what each representation adds and what it obscures.
Interpreting Complex Situations
Markets often create mixed evidence. For example, a chart might show price breaking out of a consolidation while volatility expands and an oscillator remains near the middle of its range. The candles document the breakout. The dispersion measure reports that movement is becoming more intense. The oscillator may not yet reflect momentum because its window still contains pre-breakout calm. None of these readings are wrong. They are time-stamped slices of the same evolving process. The most reliable way to interpret them is to keep track of what each measure is designed to report and how quickly it can respond.
Parameter Sensitivity and Overfitting
Indicators require parameters like lookback length or smoothing factor. Small changes in parameters can have large visual effects, especially on short timeframes. It is tempting to tune parameters until the indicator seems to fit a past period of data perfectly. That often produces overfitting, where the indicator is aligned to historical quirks that are unlikely to repeat. Price action is not immune to a similar problem. Rules for what counts as a swing or how to treat overlaps can be tailored to past patterns. In both frameworks, the cure is restraint and an appreciation of how much randomness is present in market data.
Risk of Double Counting
Another interpretive risk occurs when multiple indicators essentially measure the same thing. A rate-of-change line, a fast RSI setting, and a MACD histogram can all deliver variations on the same momentum message. If each is treated as an independent confirmation, the assessment may be biased. Looking for diverse information sources is more useful than stacking similar ones. The chart reader can ask whether each study adds a distinct dimension such as trend, volatility, or relative position, rather than repeating the same dimension three ways.
A Balanced Mental Model
The most robust mental model treats price as the ground truth and indicators as lenses. Each lens has a focal length and a field of view. A long focal length smooths out roughness but blurs details. A short focal length reveals texture but can mistake noise for change. Oscillators turn slopes and rates into cyclical lines that are easier to compare across instruments. Dispersion measures turn uneven spacing of candles into boundaries around a mean. None of these lenses create new facts. They clarify parts of the story and are most useful when extended to the appropriate context.
Reading a Chart: A Neutral Workflow
One neutral workflow for interpretation is to begin with the price pane, identify recent swing structure and key levels, and then compare these observations with one or two indicators. If the moving average slope aligns with a sequence of higher highs and higher lows, that suggests the lens and the ground truth agree. If an oscillator is rising while price is compressed, that suggests momentum has picked up relative to its lookback even if the structural breakout is not yet visible. Conflicts between representations can be noted and tracked over time as the window evolves.
This approach does not prescribe any action. It is a way of keeping the hierarchy of information clear so that derived signals are never mistaken for independent facts.
Limitations and Responsible Interpretation
Neither price action nor indicators can escape the inherent uncertainty of markets. Price can feint and reverse. Indicators can shift and then shift back. Structural breaks can fail. Sustained trends can run beyond what an oscillator implies is typical. All tools can be informative when used to describe the present and the immediate past. Difficulties arise when descriptive signals are treated as deterministic forecasts. The safest interpretive posture is to see charts as maps, not as guarantees.
Key Takeaways
- Price action is the primary record of market movement, while indicators and oscillators are derived transforms of that record.
- Indicators reduce noise and add structure but introduce lag and depend on parameter choices, whereas price action preserves timing and detail at the cost of higher noise.
- Overlays and sub-panel oscillators present different facets of the same history, and their disagreements usually reflect transformation and timing rather than conflicting truths.
- Redundancy across similar indicators can create false confirmation; seek diverse dimensions such as trend, momentum, and volatility rather than multiple versions of the same measure.
- Interpretation improves when the hierarchy is clear: read price first, then use indicators as lenses that clarify specific features without treating them as independent predictors.