Indicator divergences are a recurring topic in technical analysis because they aim to capture non-confirmation between price and a secondary measure such as momentum or volume. When an indicator fails to echo the new extreme made by price, it signals a potential change in the character of the move. Divergences do not predict direction with certainty, nor do they instruct immediate action. They provide context about whether the force behind a move is strengthening or weakening.
What Is an Indicator Divergence
A divergence occurs when price makes a new extreme while a selected indicator does not. For example, price prints a higher high, but a momentum oscillator records a lower high. Or price prints a lower low, but the oscillator prints a higher low. The lack of confirmation suggests that the latest push in price is not fully supported by momentum, participation, or volatility, depending on the indicator used.
The core idea is straightforward. Price is the final outcome of many participants transacting. Indicators, built from price and sometimes volume, summarize aspects such as speed, acceleration, or participation. When price extends but the summary measure does not, there is a mismatch in the underlying dynamics.
Why Non-Confirmation Matters
Non-confirmation is meaningful because trends are sustained when both price and the drivers behind price move in the same direction. In a persistent uptrend, new highs are often accompanied by strong momentum readings, broad participation, or expanding volume. If price reaches a new high but momentum readings fall short, the up move may be losing energy. The same applies in downtrends. A new low with diminishing downside momentum can reflect exhaustion rather than acceleration.
Traders pay attention to divergences for several reasons:
- They can highlight weakening thrust after an extended move.
- They can mark inflection zones where price becomes more two-sided or consolidates.
- They may coincide with changes in volatility, liquidity, or participation.
- They help distinguish between continuation with strength and continuation by drift.
Divergence does not imply reversal on its own. Price can consolidate, mean-revert modestly, or continue in the original direction with time. It is one piece of evidence that invites a closer look at structure and context.
Where Divergences Show Up
Divergences can be examined with a variety of indicators. The most common group is momentum oscillators, but volume based and volatility sensitive measures also appear frequently.
Momentum Oscillators
Momentum oscillators compress price changes over a fixed window into a bounded or unbounded scale. Examples include the Relative Strength Index, Stochastic Oscillator, Commodity Channel Index, and rate-of-change measures. These indicators tend to peak before price in late-stage advances and bottom before price in late-stage declines. They are well suited for divergence analysis because they react to the pace of price movement.
MACD and Histogram
The Moving Average Convergence Divergence line captures the difference between two exponential moving averages. The histogram is the difference between the MACD line and its signal line, which emphasizes shifts in momentum. A bearish divergence might appear when price prints a higher high, the MACD histogram prints a lower high, and the MACD line itself also lags.
Volume Based Indicators
On-Balance Volume, Accumulation Distribution Line, and other volume weighted measures attempt to gauge participation or buying and selling pressure. If price rises to a higher high while OBV fails to make a higher high, the new price high may have occurred on reduced participation.
Volatility Sensitive Measures
Indicators that blend momentum and volatility, such as certain standardized rate-of-change measures, can also diverge from price. A price extension that occurs on narrowing volatility bands or reduced realized volatility can look powerful on a price chart yet remain unconfirmed by volatility measures.
Which Price Points to Compare
Divergences are defined by comparing swing points. For a bearish divergence, compare the most recent higher high in price to the corresponding high in the indicator. For a bullish divergence, compare the most recent lower low in price to the corresponding low in the indicator. Alignment matters. The indicator reading should be taken from the same bar or candle that produced the price extreme, or from the immediate neighborhood if the indicator is calculated on closing prices only.
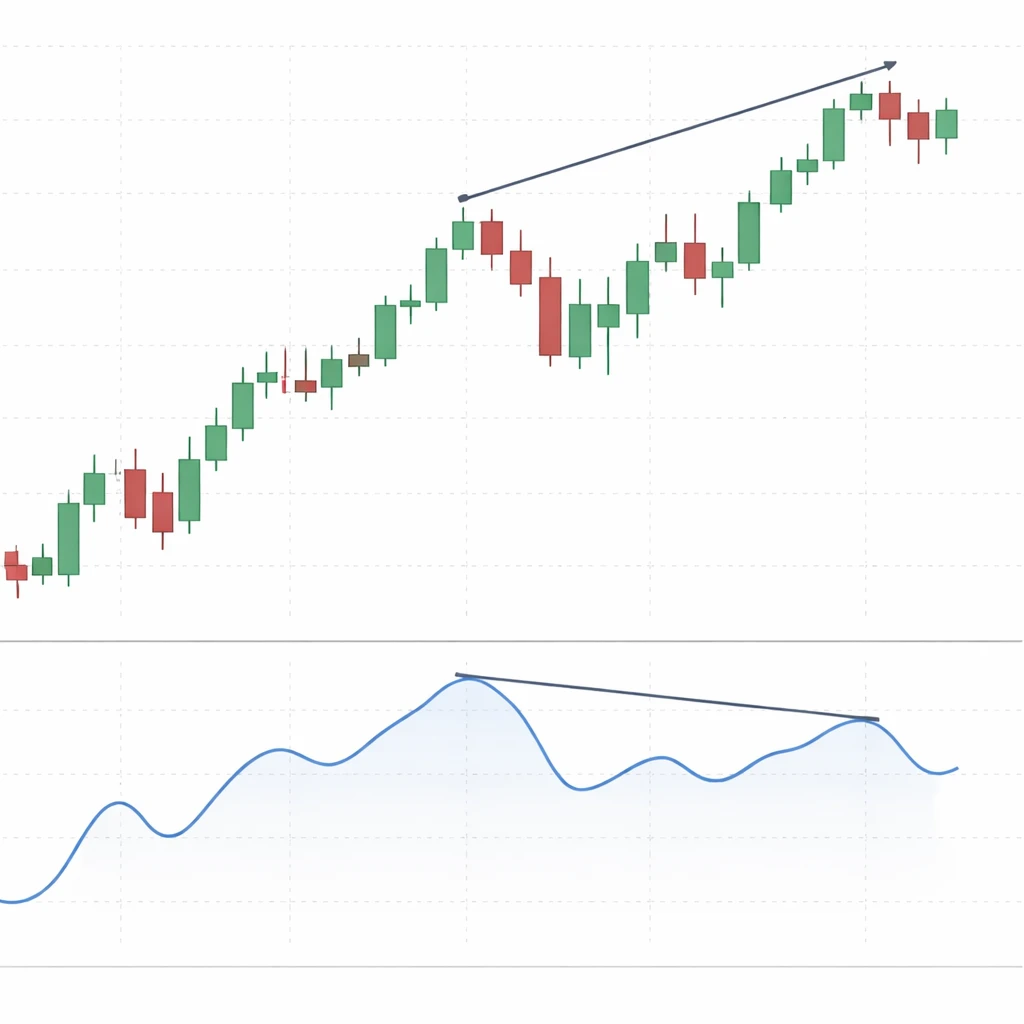
Analysts often annotate divergences by drawing short diagonal lines connecting the two most recent price highs or lows, and parallel lines connecting the associated indicator highs or lows in the subpanel. If the slopes oppose each other, a divergence is present. Precision improves if the swing points are clear and not subjective. Many practitioners define a swing high as a high preceded and followed by lower highs, and a swing low as a low preceded and followed by higher lows. This reduces noise.
Types of Divergence
Regular or Classic Divergence
Regular divergence highlights potential exhaustion of the prevailing move.
Bearish regular divergence: price makes a higher high, indicator makes a lower high. This suggests that the upward leg lacks the momentum that drove the previous high.
Bullish regular divergence: price makes a lower low, indicator makes a higher low. This suggests downside pressure may be weakening relative to the prior swing.
Regular divergences align with the idea of a potential loss of force in the prevailing direction. They often occur near the ends of extended swings but can also appear within ranges.
Hidden Divergence
Hidden divergence is sometimes described as a continuation type non-confirmation. It occurs when price makes a higher low during an uptrend while the indicator makes a lower low, or when price makes a lower high during a downtrend while the indicator makes a higher high. In an uptrend, a higher price low with a lower oscillator low suggests that a pullback had relatively stronger momentum on the indicator yet failed to push price to a lower low, which is consistent with trend strength. The reverse logic applies in a downtrend.
Hidden divergence is sometimes misread as a reversal clue. It is better understood as a way to assess whether pullbacks are erasing structure or simply releasing pressure within the existing trend.
Exaggerated Divergence and Failure Swings
Exaggerated divergence occurs when price forms a double top or bottom around the same level while the indicator forms a noticeably lower high or higher low. Failure swings are a related concept in which the indicator fails to exceed a prior high or low and then reverses, even if price has not clearly broken structure. Both patterns reflect non-confirmation, although definitions vary across texts and platforms.
How Divergences Appear on Charts
Divergences are best seen with a clean chart that separates price bars and the indicator in a subpanel. Annotate only the relevant swing points to prevent visual clutter. The look-back period of the indicator influences divergence frequency. Short windows are sensitive but noisy, while long windows are smoother but slower to reflect change.
Consider a daily chart with a 14-period RSI below the price panel. Price rallies from 100 to 110 and RSI peaks near 70. After a short consolidation, price rallies again to 112, but RSI peaks at 64. Price made a higher high, RSI made a lower high. The lack of confirmation is clear when two short lines are drawn above the price highs and above the RSI highs. This arrangement is a textbook bearish regular divergence on a momentum oscillator.
Now consider a downtrend in which price falls from 200 to 170 while RSI bottoms at 30. A rally to 178 lifts RSI to 45, then price declines again to 168, but RSI bottoms at 35. Price printed a lower low, RSI printed a higher low. This is a textbook bullish regular divergence. The logic is symmetric to the prior example.
With MACD, divergences commonly appear in the histogram. Price may register a marginal higher high, yet the histogram prints a shallower peak. The MACD line itself may also fail to take out its prior high. The presence of both makes the non-confirmation more evident because the same momentum concept is captured in two related ways.
Practical, Chart-Based Context
Examples help anchor the definitions. The following scenarios illustrate how divergences present without implying any specific action or outcome.
Example A: Bullish Regular Divergence in a Decline
Assume a 60-minute chart of a liquid index future. After a steady decline, price prints a low at 4,020, rallies to 4,090, and then presses lower to 4,010. The 14-period RSI bottoms near 28 on the first low and near 34 on the second low. Price made a lower low of 4,010, but RSI made a higher low of 34. The second leg down covered less ground in the oscillator, even though price marginally exceeded the prior low. This suggests the second selloff lacked the same downside energy. On the chart, two lines make the contrast obvious: a slightly downward sloping line through the two price lows and a slightly upward sloping line through the two RSI lows.
What happens next can vary. Price may bounce and consolidate, it may reverse further, or it may grind sideways. The divergence only indicates that the most recent low occurred with less measured momentum than the prior low.
Example B: Bearish Regular Divergence Near Resistance
Consider a daily chart of a large-cap equity approaching a multi-month resistance zone around 75. The stock initially peaks at 74.50 with MACD histogram at a high value. After a two-week pullback, it pushes to 75.20, but the MACD histogram makes a lower high relative to the previous peak. The MACD line also shows a slightly lower peak. Price pushed through resistance marginally, yet the momentum measure failed to confirm. If the stock then hesitates near the old resistance, the divergence highlights a potential vulnerability in the advance. It does not state that price must reverse. It states that the second push higher did not carry the same momentum as the first.
Example C: Volume Based Divergence on a Breakout Attempt
On-Balance Volume often confirms or refutes the quality of a breakout. Imagine a range between 48 and 52 that has persisted for several weeks. Price closes above 52 at 52.60, but OBV remains beneath its prior swing high from two weeks earlier. A few sessions later, price probes 53.10, while OBV still fails to exceed its old high. The breakout advance exists on price only, not on the participation proxy. The divergence suggests thinner participation than the prior advance inside the range. Markets can still advance on light participation for a time, but the non-confirmation flags fragility.
Interpreting Divergences in Context
Divergence analysis does not stand alone. Context helps interpret what a divergence might imply about risk in the current environment.
Trend context. Divergences in the direction of the higher time frame trend tend to be less informative about reversal risk and more informative about consolidation or reversion to the mean. For instance, a bearish divergence in a strong weekly uptrend often precedes sideways movement or shallow pullbacks rather than deep declines. Conversely, a bullish divergence in a persistent bear trend can precede rebounds that relieve oversold conditions without shifting the larger trend.
Location relative to structure. The meaning of non-confirmation changes if it occurs at a prior high or low, a well-observed range boundary, a long moving average, or a pivot defined by multiple touches. A divergence into a major structural level may carry more information than the same pattern in the middle of a noisy range.
Volatility regime. In low volatility regimes, price often advances by drift, with small daily ranges and modest oscillator readings. Divergences can persist for long periods while price grinds. In high volatility regimes, oscillators swing aggressively, creating frequent, short-lived divergences. Interpreting the signal requires awareness of the current regime.
Liquidity and time of day. Intraday divergences that occur during thin liquidity windows can be less reliable. For example, an early morning thrust on low volume may create a temporary divergence in a volume based indicator that disappears once regular trading hours deepen liquidity.
Multiple time frames. Divergences can be nested or conflicting across time frames. A bullish divergence on a 15-minute chart can occur inside a bearish divergence on a daily chart. The interpretation depends on the horizon of interest. Short horizons focus on local swings; longer horizons focus on major legs.
Common Pitfalls and Limitations
Divergences invite subjective interpretation. Several pitfalls recur in practice.
Forcing the pattern. If swing points are not clear, drawing lines to show divergence can become arbitrary. Using a consistent definition of swing highs and lows reduces this risk.
Ignoring the magnitude of price change. A minor fractionally higher high on price with a slightly lower oscillator peak may not carry much meaning. Size matters. Some analysts require a minimum percentage difference in price and a noticeable difference in the indicator before labeling a divergence.
Parameter sensitivity. Oscillator look-back length affects the frequency and timing of divergences. A setting that works on one instrument or regime may not translate elsewhere. Testing across regimes and instruments is crucial for any systematic use, although discretionary chart readers can also benefit from awareness of this sensitivity.
Divergences can persist. Price can continue trending even while momentum wanes. This is common late in trends and during low volatility advances. A divergence simply describes a weakening relationship, not an endpoint.
News and structural breaks. Macro announcements, earnings releases, policy changes, or other exogenous shocks can overwhelm technical relationships in the short term. Divergences lose relevance when new information resets expectations.
Indicator construction matters. MACD histogram measures a change in the MACD line, which itself measures a difference of moving averages. An RSI reading is bounded, while MACD is not. OBV accumulates signed volume and can be skewed by off-market prints or data errors. Understanding what an indicator summarizes helps interpret its divergences.
Statistical mixed evidence. Academic and practitioner studies report mixed results on the predictive power of divergences when examined in isolation. Some studies find short-horizon mean reversion tendencies after certain divergences, but the effects are sensitive to definition, sample period, and asset class. This cautions against relying on divergences as standalone tools.
Toward Objective Identification
Subjectivity can be reduced with clear rules for identifying divergences, even for discretionary analysis.
Define swing points. A common rule is to mark a swing high when it is followed by at least two lower highs, and a swing low when followed by at least two higher lows. This ensures that swings are not designated prematurely.
Anchor indicator values to the same bars. When a swing high is confirmed, record the indicator value from the bar that set the high. Compare only confirmed pairs to avoid look-ahead bias.
Require minimum differences. For example, require at least a 0.5 percent difference between price highs and a meaningful difference in the oscillator reading, such as several RSI points, before labeling a divergence. Thresholds should reflect the instrument’s volatility.
Consistency across time frames. Use the same identification rules on all time frames under review. This allows better comparison of divergences across horizons.
Combining Indicators Without Redundancy
Using multiple indicators that measure the same concept can give a false sense of confirmation. RSI, Stochastic, and rate-of-change are all momentum tools and often correlate. MACD and its histogram are also momentum oriented. OBV and Accumulation Distribution reflect participation. When combining, consider mixing one momentum measure with one participation or volume measure to avoid double counting the same signal. Even then, overlapping information is common because all indicators are derived from the same underlying price and volume series.
Time Frame and Instrument Considerations
Divergence behavior varies by horizon and by asset class.
Intraday vs daily or weekly. Intraday charts show more divergences due to noise. Many resolve quickly without structural impact. Daily or weekly divergences appear less frequently and can mark more significant shifts in behavior, although they remain far from deterministic.
Equities vs commodities vs currencies. Equities often exhibit momentum features related to earnings cycles and index flows. Commodities can reflect seasonal and inventory dynamics, sometimes producing sharp reversals after extended moves where divergences are common. Currencies often trend during policy divergence periods and can maintain divergences for longer due to carry and macro flows. These tendencies are descriptive, not prescriptive.
Liquidity and microstructure. Thinly traded instruments are prone to spurious price extremes that create artificial divergences. Highly liquid instruments produce cleaner swings but can still show extended sequences of small divergences during grind phases.
Reading Divergences Alongside Market Structure
Divergence analysis gains meaning when read alongside structure and levels.
Support and resistance. Non-confirmation into a well-defined level signals that the test lacked comparable drive. When price approaches resistance with a bearish divergence, or support with a bullish divergence, the level and the weakening impulse form a coherent narrative about potential two-sided trade.
Trendlines and channels. Channels visualize rhythm. A divergence as price tests the upper boundary of an ascending channel often reflects slowing momentum at the same time that price meets geometric resistance. Similarly at the lower boundary in a descending channel.
Gaps and events. Prices that gap into new territory frequently invalidate recent oscillator comparisons, because the indicator may not reflect the sudden jump. Divergences identified before a gap can become irrelevant once the market reprices.
Workflow for Chart Review
A structured workflow improves consistency in reading divergences.
First, identify the prevailing trend and major levels. Second, mark recent confirmed swing highs and lows. Third, check whether the indicator peaks and troughs align with those swings. Fourth, decide whether any divergence is material or trivial based on magnitude and context. Finally, monitor how price behaves after the non-confirmation appears, looking for changes in volatility, range, and participation.
This workflow emphasizes sequence rather than outcome. The objective is to understand how well the latest price move is supported by its underlying drivers, not to generate a specific trade instruction.
Worked Illustration Without a Chart Image
To make the mechanics concrete, consider a hypothetical sequence on a daily chart of a broad index ETF with RSI and MACD in subpanels:
1. Price rises from 380 to 400 over ten sessions. RSI peaks at 66, MACD line rises, and the histogram reaches 1.2 units.
2. A three-session pullback takes price to 394, RSI to 49, and the histogram near zero.
3. Price rallies to 403, a marginal new high. RSI peaks at 61, below its prior 66. MACD line makes a slightly lower high, and the histogram peaks at 0.8. This is a bearish regular divergence visible on both indicators.
4. Over the next week, price oscillates between 398 and 404 with narrowing ranges. RSI compresses around 50 to 55, and the histogram alternates small positive and negative values. The divergence aligned with a transition from thrust to balance rather than an immediate reversal.
5. Two weeks later, price resolves out of the consolidation. The initial divergence described the weakening thrust and the potential for a pause; what followed depended on broader conditions.
This illustration underscores that divergences can mark transitions in market behavior, even when direction remains unresolved for a time.
Documentation and Review
Whether one uses automated scans or manual review, documenting divergences with screenshots and notes fosters better evaluation. Record the date of the divergence, the instruments involved, the indicator settings, the time frame, the structural location, and the subsequent evolution of price, volatility, and volume. Over time, this builds an empirical sense of when a given definition of divergence is informative for a particular market and horizon.
Final Perspective
Indicator divergences are best understood as a language for describing when price and an underlying driver lose alignment. They are neither rare nor decisive on their own. Their value lies in clarifying whether a move is broad and forceful or narrower and tiring. When mapped carefully to swing points, placed in structural context, and read with awareness of regime and instrument, divergences add nuance to chart interpretation without implying certainty.
Key Takeaways
- Indicator divergences occur when price makes a new extreme that is not confirmed by an indicator, signaling possible weakening in the underlying force of the move.
- Regular divergences often align with potential exhaustion of the prevailing swing, while hidden divergences relate to trend continuation dynamics.
- Accurate identification depends on clear swing definitions, consistent alignment of price and indicator points, and attention to magnitude.
- Context matters, including trend, structural levels, volatility regime, liquidity, and time frame, all of which shape how a divergence may resolve.
- Divergences are descriptive rather than prescriptive and should be treated as non-confirmation evidence rather than stand-alone trading instructions.