Technical indicators reduce complex price movement into structured signals. Used individually, they often produce mixed or late information. Indicator confluence describes the situation in which several indicators align to describe the same price condition at roughly the same time. The value of the concept lies in interpretation rather than prediction. Confluence can help an analyst read a chart with greater discipline by checking whether trend, momentum, volatility, and participation tools point in a consistent direction.
Defining Indicator Confluence
Indicator confluence is the independent agreement of multiple indicators about the state of the market. The emphasis falls on independent and state. Independent means the indicators are not simply different versions of the same calculation. A short moving average and a slightly longer moving average often respond similarly because both transform price through smoothing. Counting them as two separate votes overstates the strength of agreement. State refers to the underlying market condition being described, such as acceleration, exhaustion, contraction, or expansion.
Confluence is not a trade signal by itself. It is an interpretive framework. When indicators with distinct inputs and mathematical structures agree, the analyst can place more weight on the contextual read of the chart. When they disagree, the chart likely contains mixed information that deserves caution or deeper inquiry.
How Confluence Appears on Charts
Confluence appears visually when several indicators that measure different aspects of price behavior move into consistent zones, slopes, or relationships. A few common examples can be described without specifying exact parameters:
- Trend alignment: Price trades above a moving average, the average has a positive slope, and a trend filter such as a directional index displays readings associated with directional movement. These elements together describe a trending state.
- Momentum agreement: A momentum oscillator sits above its midline while a MACD-style histogram is positive. Both communicate positive acceleration relative to recent history.
- Volatility expansion: Bollinger Bands widen and Average True Range increases. Both describe a shift from quiet to active conditions.
- Volume or participation confirmation: On Balance Volume or a volume-weighted measure rises alongside price, suggesting participation is aligned with price movement.
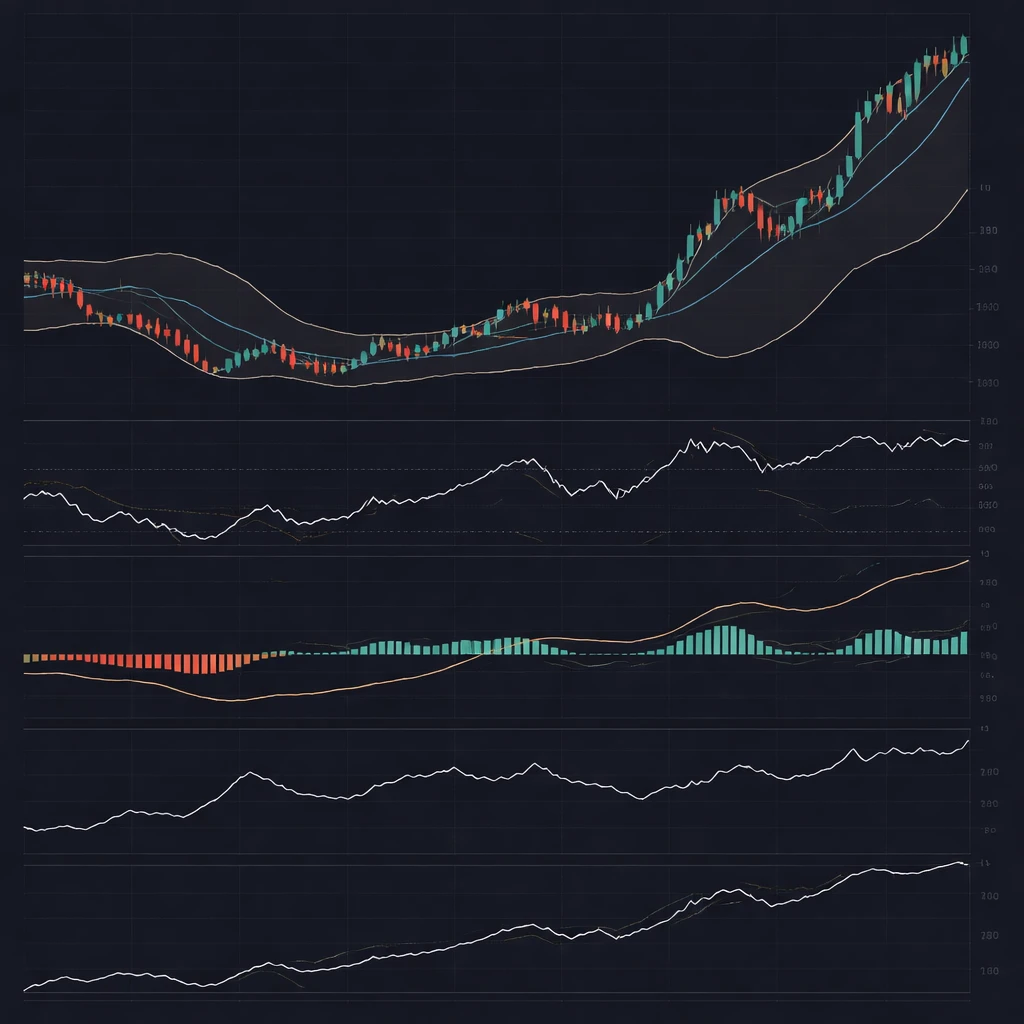
On a chart, these appear across panes. The price pane shows moving averages or bands. Subpanes show momentum or volume tools moving through thresholds or changing slope. Confluence is strongest when these visual features arrive together or in a sequence that is mechanically plausible. For example, momentum tends to shift before a sustained trend slope changes, while volatility expansions often follow periods of contraction.
Why Analysts Pay Attention to Confluence
Indicators are simplifications. They compress information and inevitably lose detail. Relying on a single indicator risks overreacting to that tool’s specific assumptions. Confluence encourages triangulation. When independent tools agree, the chance that the observation reflects a broad feature of the data rather than a quirk of one formula may increase. Confluence also disciplines the reading process. It asks the analyst to check more than one lens and to articulate whether trend, momentum, volatility, and participation tell a coherent story.
Another benefit is noise reduction. Markets exhibit random variation around any pattern. A moving average crossover can occur simply due to short-term noise. If momentum and volume measures remain flat, the analyst has a reason to doubt that a structural change has occurred. The goal is not to eliminate noise but to avoid elevating it to the status of a robust observation.
What Confluence Is Not
Confluence is not the same as confirmation bias. Confirmation bias seeks evidence that supports a prior view. Indicator confluence, correctly used, starts with a neutral observation and tests it against independent dimensions. It is also not the same as redundancy. Redundancy occurs when several indicators provide the same information due to similar inputs. Counting redundant indicators as separate confirmations can mislead the reader into an overstated sense of agreement.
Indicator Families and Redundancy
Useful confluence typically draws from different indicator families. These families approximate distinct dimensions of market behavior:
- Trend: moving averages, trend channels, directional indices.
- Momentum: oscillators built on rate of change, relative strength, or smoothed differences.
- Volatility: measures of dispersion such as ATR or band width.
- Participation or flow: volume-based tools including OBV or volume oscillators.
Choosing one tool from each family reduces the risk of counting the same information twice. A moving average and a price channel both smooth price and may deliver similar insights. Pairing them with a momentum oscillator and a separate volatility measure produces a more orthogonal set of readings.
Timeframe and Parameter Sensitivity
Indicators are parameter dependent. Lookback lengths, smoothing choices, and thresholds shape their behavior. Confluence built on ill-matched parameters can be artificial. For example, a very short momentum oscillator may pivot many times inside a day, while a long moving average barely changes. Apparent disagreement in this case says little about market structure and more about time sensitivity. When assessing confluence, match the temporal horizon of the tools as closely as possible, or deliberately use a multi-timeframe approach with clear expectations for how shorter and longer horizons should interact.
Multi-timeframe confluence refers to agreement across horizons. Trend tools on a weekly perspective may slope upward while daily momentum oscillates between overbought and oversold zones. An analyst might view daily pullbacks differently when they occur within a higher timeframe uptrend compared with a higher timeframe downtrend. The important point is clarity about which horizon dominates the interpretation.
How Confluence Helps Interpret Price Behavior
Consider how the market transitions through states. Quiet consolidation often features low volatility, narrow ranges, and momentum near zero. A move out of consolidation that persists usually shows a sequence: momentum shifts, volatility expands, and trend measures turn. When several indicators register this shift in the expected sequence and within a reasonable window, the analyst can argue that the market condition has changed, not just a bar-to-bar fluctuation. Conversely, if price attempts to move but volatility stays muted and momentum fails to clear its midline, the evidence of change is weak.
Confluence also assists with reading potential exhaustion. If price rises but momentum fails to rise with it, a divergence appears. Divergence alone does not make a forecast. If the divergence coincides with a flattening of trend measures and a contraction of participation, the combined evidence describes a market that is losing internal support for continuation.
Practical Chart-Based Context
The following neutral scenarios illustrate how confluence affects interpretation without implying any action:
- Trend continuation context: Price remains above a rising moving average. A momentum oscillator stays mostly above its midline, dipping only shallowly during pullbacks. MACD-type readings remain positive even as their histogram oscillates. ATR expands during pushes and contracts during pauses. Together, these elements describe persistent directional pressure with normal counter-moves.
- Transition from quiet to active: Band width compresses for several sessions, ATR declines, and momentum oscillates near zero. Suddenly, a large-range bar appears, band width begins to increase, and the oscillator clears its midline. This combination reads as a shift from balance to imbalance with growing volatility.
- Potential exhaustion context: Price makes a marginal new high. Momentum fails to achieve a new high and begins to roll over. The slope of the trend filter flattens. Volume-based measures do not confirm the new price extreme. The ensemble suggests that recent highs may not be supported by broad internal strength.
- Range-bound description: Trend measures remain flat, momentum oscillates between overbought and oversold thresholds, and ATR remains below its median. The picture is consistent with a market that alternates between mean-reverting swings rather than directional travel.
Each scenario shows how reading multiple dimensions together produces a richer narrative of market behavior than any single indicator could provide.
Visualizing Confluence on a Chart
Clear visualization makes confluence easier to evaluate in real time:
- Place complementary indicators in separate panes with aligned time axes. This keeps relationships visually apparent.
- Use consistent threshold markers, such as midlines on momentum tools or zero lines on histogram-style indicators.
- Mark periods of volatility contraction and expansion by shading or simple annotations, so that momentum shifts can be read in the context of changing dispersion.
- When feasible, keep the number of indicators modest. Too many panes reduce focus and increase the chance of false agreement.
Common Pitfalls
Several mistakes recur when analysts attempt to use confluence:
- Counting correlated tools as independent: Using multiple smoothed price measures creates an illusion of agreement. Check whether indicators share inputs or transformations.
- Parameter mismatch: Very short and very long windows rarely offer meaningful real-time confluence. If they are combined, understand the expected sequence between horizons.
- Look-ahead bias in examples: Drawing examples with perfect hindsight improves the apparent reliability of confluence. Real charts include imperfect and conflicting signals.
- Ignoring regime shifts: Relationships among indicators change during high-volatility or news-driven periods. Confluence that worked in quiet markets can break down during shocks.
- Overfitting confluence rules: Tweaking parameters until historical charts show frequent agreement builds fragile rules that may not generalize.
Measuring Confluence More Objectively
While many practitioners use confluence as a qualitative concept, it can be structured more formally to improve consistency. The following approaches do not require detailed statistical modeling yet reduce subjectivity:
- Binary checklist: Define a small set of conditions such as trend slope positive, momentum above midline, and volatility expanding. Assign one point to each condition satisfied on the current bar. The total score gives a confluence level from zero to the maximum.
- Scaled scoring: Replace binary thresholds with scaled contributions. For example, the strength of a momentum oscillator’s deviation from its midline contributes proportionally to a momentum score. Combine scaled scores from different dimensions.
- Correlation screening: Before including indicators in a confluence set, estimate how closely they move together over a historical sample. Highly correlated pairs can be reduced to one representative.
- Window consistency checks: Periodically evaluate whether confluence scores have different distributions across regimes, such as low-volatility versus high-volatility markets.
These steps turn confluence into a repeatable framework rather than an impressionistic judgment.
Confluence Across Assets and Regimes
Indicators behave differently across assets. A commodity with frequent gaps and seasonality can produce different indicator dynamics than a large equity index with more continuous trading. Fixed income instruments often show smoother trends with lower realized volatility compared with small-cap equities. A confluence framework should be tested and calibrated for the asset class under observation.
Regime changes also matter. During crisis periods, volatility dominates most dimensions. In such times, trend and momentum can shift quickly and frequently, lowering the incidence of stable confluence. In quiet periods, volatility contributions shrink and trend plus momentum align more gradually, creating clearer confluence stretches. Recognizing the ambient regime helps interpret whether a lack of agreement is meaningful or simply a feature of the current environment.
Divergence and Confluence Together
Divergence occurs when price and an indicator move in different directions. Divergence itself is a single-indicator observation. When placed inside a confluence framework, divergence becomes more informative. If price posts a new high while momentum diverges, but trend slope and participation remain supportive, the overall confluence is mixed. If multiple dimensions also falter, the divergence has corroboration. The key is not to elevate any one reading above the ensemble.
Sequence and Timing
Indicators respond at different speeds. Momentum typically reacts first, trend measures later, and volatility can expand either before or after price clears a range, depending on the nature of the transition. Confluence evaluated without attention to sequence can be misleading. A brief momentum turn against an otherwise intact trend often occurs during normal pullbacks. An analyst who treats every such moment as a breakdown of confluence is likely to misread the chart. Establish the expected order and time window within which agreement should appear for a given market condition.
From Chart Note to Structured Interpretation
One way to bring discipline to confluence analysis is to turn visual notes into structured observations. Consider a hypothetical daily chart of a large equity index during a two-month advance:
- Week 1 to Week 3: Price rises above a medium-term average and holds. Momentum crosses its midline and stays positive. ATR rises modestly from depressed levels. The picture describes a young trend with growing activity.
- Week 4: A pullback develops. Price touches the moving average intraday but closes above it. Momentum dips but remains near its midline. ATR contracts. The ensemble describes digestion rather than reversal.
- Week 5 to Week 6: Price pushes to a new high. Momentum expands and MACD-type measures increase. ATR rises again. Confluence suggests trend continuation.
- Week 7: Price posts a marginal high with smaller real bodies. Momentum fails to confirm and turns down. The trend slope flattens and volume participation wanes. Confluence weakens and the chart reads as late-phase.
This narrative uses indicator alignment to label states across time without implying any decision. It provides a common language for discussing how price behavior evolves.
Data Quality and Practical Considerations
Confluence relies on accurate, timely data. Indicators calculated on delayed or inconsistent feeds can misalign, especially for intraday assessments. Different charting platforms may implement indicator formulas with slight variations, such as choices of mean for volatility bands or differences in smoothing. If two tools seem to disagree inexplicably, check the data and implementation details before inferring a market message.
Scaling and visibility also matter. Overcrowded charts encourage selective attention. A clean layout improves the ability to judge whether alignment is real. Consistent color schemes for positive versus negative states across indicators reduce cognitive load.
Cognitive Bias and Confluence
Humans are pattern-seeking. Confluence can be misused as a license to find patterns where none exist. Predefining the indicators, their parameters, and what counts as agreement reduces the risk of apophenia. A written checklist or scoring template can be helpful for repeatability. Over time, reviewing instances where confluence appeared but the market later behaved differently can highlight which dimensions were most informative and which were redundant.
Limitations of Indicator Confluence
There are inherent limits to what confluence can deliver. Indicators are transformations of price and volume. They cannot foresee regime shifts that arrive with new information. During events such as policy announcements or earnings surprises, confluence assessed from prior data can evaporate instantly. In addition, many indicators are lagging, which means that by the time they agree, a large portion of a move may have already occurred. Finally, heavy reliance on confluence can lead to underreaction if the framework requires near-perfect agreement before acknowledging a change in state.
Applying Confluence to Ongoing Analysis
In routine chart study, confluence can be used to structure notes, highlight transitions between states, and archive evidence. For example, an analyst might tag daily chart snapshots with a short confluence summary covering trend, momentum, volatility, and participation. Over a sample of observations, these tags become a data set for learning how often specific kinds of alignment persisted and under what circumstances they failed.
Closing Thoughts
Indicator confluence is best understood as an interpretive discipline rather than a recipe. By selecting a few complementary tools, matching their horizons, and checking for genuine independence, the analyst can read the chart in a way that reduces noise and anchors judgment to observable features. The aim is not to guarantee outcomes. It is to form coherent, evidence-based descriptions of market behavior that can be reviewed, debated, and improved over time.
Key Takeaways
- Indicator confluence occurs when independent indicators align to describe the same market state, such as trend strength or volatility expansion.
- True confluence draws from different families like trend, momentum, volatility, and participation, avoiding redundant signals from correlated tools.
- Timeframe and parameter choices shape confluence. Agreement is most informative when horizons are aligned or the expected sequence across horizons is defined.
- Confluence improves interpretation by filtering noise and encouraging structured, evidence-based chart reading, but it does not remove uncertainty.
- Limitations include lag, regime dependence, and the risk of overfitting. A simple, consistent framework helps maintain objectivity.