Introduction
Drawdown is a foundational concept in risk management. It describes how far an account or strategy falls from a prior peak before it recovers. While returns often receive the most attention, the path of returns determines whether capital survives long enough to benefit from any strategy’s edge. Drawdowns directly affect capital preservation, investor confidence, and operational continuity. Understanding what drawdowns are, how to measure them, and how they emerge in live trading is essential for assessing risk realistically.
At its core, a drawdown is not a prediction about the future. It is a measurement of realized deterioration from a previous high point. This makes it a disciplined way to assess the cost of volatility, leverage, and execution frictions. It also helps distinguish between temporary fluctuation and structural damage to a trading approach.
Defining Drawdown
A drawdown is the decline from an equity peak to a subsequent trough. Equity can refer to the value of a trading account, a portfolio, or the cumulative profit and loss of a strategy. Drawdowns are typically reported in percentage terms, though absolute currency amounts can be used for internal accounting.
Three related terms are useful:
Peak. The highest equity level achieved so far.
Trough. The lowest equity level reached after that peak, before a new high is established.
Drawdown. The difference between the peak and the trough, usually expressed as a percentage of the peak.
Example. Suppose an account reaches a peak value of 100, then declines to 85 before rising again. The drawdown from that peak is 15 percent. If the account later rises to 105 and then falls to 98, the new drawdown is 6.7 percent, measured from 105 to 98. Drawdown is always measured relative to the most recent peak.
Types of Drawdowns
Practitioners commonly refer to several related measures. Distinguishing them clarifies discussions of risk control.
Point-in-time drawdown. The current decline from the most recent equity peak. It fluctuates as markets move.
Maximum drawdown. The single largest peak-to-trough decline over a specified history. Maximum drawdown is path dependent and can be highly sensitive to the sample period.
Duration. The time from a peak to the point when the prior peak is regained. A drawdown with short duration can be psychologically and operationally easier to tolerate than a shallow drawdown that drags on for months.
Recovery time. The time required to climb from the trough back to the previous high. Duration and recovery are sometimes combined into one measure that begins at the peak and ends when a new high is reached.
These measures describe different dimensions of the same phenomenon, depth and time. Focusing on depth alone misses the operational impact of slow recoveries. Focusing on duration alone misses the severity of losses that must be recovered.
Why Drawdowns Matter for Capital Preservation
Drawdowns affect survivability. A deep loss requires a larger percentage gain to recover back to breakeven because the base has shrunk. For example, a 20 percent loss requires a 25 percent gain to recover. A 50 percent loss requires a 100 percent gain. The more severe the drawdown, the more fragile compounding becomes, especially when constraints such as margin, risk limits, or investor redemptions restrict the ability to hold positions through recovery.
Drawdowns also affect behavior. Large or prolonged drawdowns can trigger changes in position sizing, early exits from valid positions, or abandonment of a strategy at the worst possible time. Even when the underlying approach has a positive expected value, behavioral responses during drawdowns can impair performance. From a governance perspective, specifying drawdown limits, escalation protocols, and pre-defined responses helps reduce ad-hoc decision making under stress. Such rules are descriptive of common practice, not recommendations for any specific trader.
Finally, drawdowns influence external stakeholders. Allocators, risk committees, and brokers monitor drawdowns as leading indicators of stress. A strategy that promises high returns but exhibits frequent or deep drawdowns may face practical constraints on leverage or capital access.
Measurement Conventions and Caveats
Drawdown measurement has details that matter for interpretation.
Percent versus absolute terms. Percentage drawdowns are standard for comparability. Currency-denominated measures are useful for internal budgeting and limit setting.
Gross versus net. Net-of-fee and net-of-cost drawdowns capture reality. Ignoring costs can understate depth and overstate recoverability.
Mark-to-market. Using daily or intraday marks incorporates open positions. Relying only on realized profit and loss understates drawdown risk when large positions are underwater but not yet closed.
Deposits and withdrawals. Cash flows can reset peaks or artificially reduce measured drawdowns if not handled properly. Most practitioners use an adjusted equity curve that removes external cash flows, so drawdowns reflect trading performance rather than funding changes.
Leverage effects. Leveraged exposures magnify drawdowns. Two strategies with identical unlevered returns can report very different drawdowns once leverage is applied.
Sample period sensitivity. Maximum drawdown depends on the historical window. A benign period can understate true risk. A stress period can dominate the statistic. Interpreting maximum drawdown requires context about market regimes, leverage, and liquidity.
Depth, Duration, and Recovery
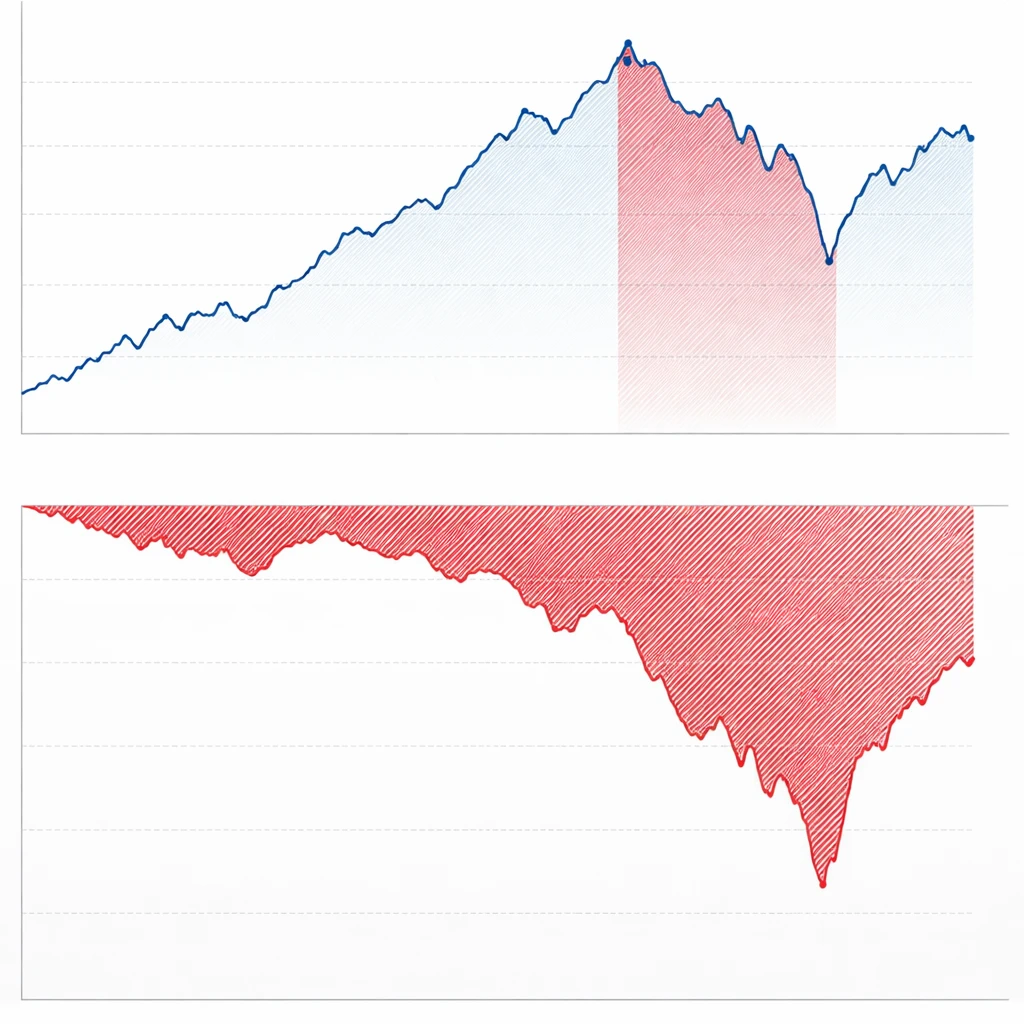
Depth and time jointly describe the burden a drawdown imposes. Consider two drawdowns of equal depth, 15 percent. One recovers in two weeks. The other takes eight months. Both have the same peak-to-trough decline, yet the long recovery ties up capital, reduces confidence, and may conflict with constraints such as investor redemption windows or capital calls. In performance reporting, an underwater chart, which plots the percentage distance from the last peak over time, conveys depth and duration clearly.
The math of recovery is asymmetric. After a loss, the base on which gains are earned is smaller. The effect is mechanical rather than behavioral, and it compounds over successive losses. Frequent small drawdowns can be manageable. Infrequent but severe drawdowns can threaten continuity even if average returns are strong. Evaluating both distribution and clustering of drawdowns over time provides a more realistic view of capital risk.
Drawdowns in Real Trading Scenarios
Drawdowns appear differently across strategies and market conditions. The same trader might see varying profiles across instruments or sub-strategies.
Trend-following example. A systematic approach that rides sustained moves may experience benign periods when trends are persistent, then sharp drawdowns during choppy reversals. During regime shifts, losses can cluster. The equity curve may exhibit long plateaus punctuated by bursts of gains and concentrated setbacks. The maximum drawdown often occurs near regime transitions.
Mean reversion example. A strategy that buys weakness and sells strength may record frequent but shallow drawdowns under normal noise, yet it can experience larger drawdowns during runaway moves when price deviates from recent averages for longer than usual. Sudden gaps or liquidity shortages can magnify the depth beyond historical norms.
Event-driven example. Catalysts such as earnings or economic releases bundle risk into discrete windows. Drawdowns can be step-like, with gaps from overnight price changes. The path between events may look stable, which can mislead when evaluating drawdown risk from a short sample.
Options example. Option portfolios can show delayed drawdowns because theta gains mask latent directional or volatility exposure. When volatility shifts or skew changes, drawdowns can materialize rapidly. Mark-to-market conventions and volatility modeling choices become central to measuring drawdowns accurately.
These examples illustrate that drawdown profiles depend on exposure, leverage, liquidity, and the timing of risks. Comparing drawdowns across strategies without normalizing for these factors can produce misleading conclusions.
Interpreting Drawdowns in Performance Evaluation
Drawdown statistics appear in due diligence, risk dashboards, and internal reviews. Several practices are common in interpretation.
Contextualize maximum drawdown. Maximum drawdown is an extreme. It reflects a single worst path segment. It should be viewed alongside the distribution of drawdowns, the number of drawdowns above certain thresholds, and the time spent underwater.
Relate drawdown to return. Ratios such as return divided by maximum drawdown, sometimes called Calmar-like ratios over a chosen period, combine reward and worst-case realized risk. These ratios depend heavily on the window, so consistent definitions are important when comparing managers or strategies.
Assess persistence. Investigate whether drawdowns cluster around identifiable conditions, such as volatility spikes or liquidity droughts. If the drivers are plausible and measurable, the drawdown profile may be better understood and stress-tested.
Evaluate capacity and liquidity. Strategies that scale into less liquid instruments can experience drawdowns that exceed backtest estimates because impact and slippage rise during stress. Paper drawdown statistics that ignore execution frictions often understate real risk.
Common Misconceptions and Pitfalls
Several recurring errors can distort how drawdowns are understood and managed.
Confusing volatility with drawdown. Volatility measures variation around a mean. Drawdown measures loss from a prior peak. A high-volatility process can have modest drawdowns if peaks are repeatedly refreshed. A low-volatility process can harbor latent tail risk and produce rare but severe drawdowns when the mean shifts.
Assuming historical maximum drawdown is a hard bound. Maximum drawdown is not a limit, it is a record of what happened in a specific window. Adding leverage, changing instruments, or encountering new regimes can produce deeper drawdowns than any seen before.
Ignoring duration. Many reviews mention only the deepest drawdown. The time spent underwater is equally important. Two strategies with the same maximum drawdown can have very different investor experiences if one recovers quickly and the other stagnates.
Comparing drawdowns without adjusting for leverage and exposure mix. A strategy with higher leverage will typically exhibit larger drawdowns for the same unlevered process. Differences in instrument liquidity and gap risk also affect drawdown severity.
Treating stop-losses as a guarantee against drawdowns. Stop orders can reduce loss on individual positions, but they do not eliminate portfolio-level drawdowns. Gaps, slippage, and correlated moves can produce losses beyond intended thresholds.
Resetting equity curves with deposits or withdrawals. Failing to adjust for external cash flows can mask the true drawdown path. Properly adjusted equity curves preserve continuity of peaks and troughs.
Underestimating compounding effects after a drawdown. Post-loss recovery often occurs with reduced position sizes due to risk limits or psychological caution. This slows the climb back to prior highs, extending duration even if the strategy’s expected value is unchanged.
Governance and Risk Controls that Reference Drawdowns
Organizations often codify drawdown awareness into governance, which can include pre-set thresholds that trigger analysis or changes to exposure. These practices are descriptive and vary widely across firms.
Soft and hard thresholds. A soft threshold can prompt a review, stress tests, or model diagnostics. A hard threshold can lead to temporary exposure reductions, aggregate risk caps, or a pause for evaluation. Thresholds are usually expressed in percentage terms and sometimes tailored to sub-strategies.
Exposure scaling. Some risk frameworks link exposure to recent volatility or to the size of the current drawdown. As drawdown widens or volatility rises, exposure is reduced. The goal is capital preservation during adverse regimes. The drawback is potential whipsaw if recoveries are quick.
Diversification and correlation oversight. Portfolios that combine distinct sources of risk can experience smaller aggregate drawdowns than any single sleeve. Correlations, however, are not static. During stress, correlations often rise, which can reduce diversification benefits just when they are needed most.
Stress testing. Historical and hypothetical shocks can be used to estimate potential drawdowns under adverse conditions. These exercises are informative, but they rely on model assumptions and may miss novel risk combinations.
All of these practices aim to align drawdown risk with capital objectives. They cannot remove drawdowns, but they can shape the profile within acceptable tolerances.
Behavioral and Operational Dimensions
Drawdowns strain decision processes. Behavioral pressures include loss aversion, overconfidence after recovery, and risk-seeking to recoup losses quickly. Operational pressures include margin requirements, investor inquiries, and reporting cycles that highlight negative periods. Clear, pre-agreed protocols for monitoring, escalation, and communication can reduce reactive choices that compound losses. Documentation of what typically causes drawdowns in a given approach helps stakeholders evaluate whether current conditions match past patterns or represent a structural break.
Drawdown and Leverage
Leverage amplifies both returns and drawdowns. When leverage is present, a moderate market move can produce an outsized equity movement, increasing the probability of breaching limits or triggering margin calls. Forced deleveraging converts a mark-to-market loss into realized loss and can lock in the drawdown at an inopportune time. The constraint is practical rather than theoretical. Funding limits and margin schedules define how much drawdown can be tolerated before positions must be cut.
Instruments with embedded leverage, such as futures or options, introduce additional dynamics. Futures require initial and variation margin. Adverse moves produce daily cash outflows. Options concentrate risk in implied volatility, skew, and time decay. Drawdowns can arise from volatility repricing even if the underlying asset moves modestly. Understanding the source of effective leverage helps interpret drawdown statistics correctly.
Path Dependence and Nonlinear Effects
Drawdowns are path dependent. The order of gains and losses matters. Two return sequences with the same average return can produce very different drawdowns. Sequences that combine small gains with occasional large losses often exhibit benign performance until a tail event occurs, then a disproportionate drawdown. Sequences with alternating wins and losses may have many small drawdowns but fewer catastrophic episodes.
Nonlinear payoffs complicate the picture. For example, selling options can accrue steady gains, followed by abrupt drawdowns when volatility spikes. Long convexity profiles can incur frequent small losses during quiet periods, then recover sharply during dislocations. The equity curve shape reveals these trade-offs. High win rates do not guarantee shallow drawdowns, and low win rates do not guarantee deep ones. The payoff distribution and position sizing rules govern drawdown behavior.
Role of Liquidity and Execution
Measured drawdowns depend on the prices at which positions can be transacted. Backtests that assume frictionless execution understate drawdowns. In live trading, spreads widen, impact rises with order size, and partial fills can extend exposure during stress. For portfolios in less liquid instruments, the mark-to-market may lag true exit prices, resulting in drawdowns that deepen upon liquidation. Monitoring capacity and updating assumptions about market depth improves the realism of drawdown statistics.
Monitoring and Reporting
Effective monitoring turns drawdowns from surprises into manageable events. Common tools include equity curves, underwater charts, rolling drawdown distributions, and dashboards that track peak-to-trough declines by strategy and at the aggregate level. Reports often pair drawdown depth with duration and recovery, and they annotate notable events, model changes, or market regime shifts. Consistency in calculation, including treatment of cash flows and fees, is essential for comparability over time.
Using Drawdown Information Without Predicting Markets
Drawdown data can inform process design without implying any market view. Examples include setting capital allocations based on historical stress outcomes, calibrating risk limits to protect operational continuity, and designing escalation protocols that prompt review during exceptional periods. These uses focus on capital preservation and transparency. They do not forecast future drawdowns, they prepare for plausible ranges based on evidence and judgment.
Practical Examples to Illustrate Concepts
Example 1, Equal returns, different drawdowns. Two strategies each return 10 percent over a year. Strategy A trends steadily upward, with a maximum drawdown of 4 percent and quick recoveries. Strategy B is flat for months, then rallies late, with a maximum drawdown of 12 percent and a long duration. Both end with the same annual return, yet their risk experiences are not comparable. The equity path matters.
Example 2, Same drawdown, different implications. Two strategies each record a 15 percent maximum drawdown. Strategy C recovers in two weeks. Strategy D takes nine months. If capital has time-based constraints, such as investor review cycles or risk committee tolerances, the long recovery can prove more costly than the depth alone suggests.
Example 3, Leverage magnification. A 5 percent unfavorable move in a modest-volatility asset might be manageable unlevered. With four times leverage, the drawdown becomes 20 percent before costs. Margin requirements may force a position reduction near the trough. The measured drawdown is now intertwined with funding constraints.
Example 4, Cash flow adjustment. An account at a 10 percent drawdown receives a deposit that increases equity above the prior peak. If the equity curve is not cash-flow adjusted, the recorded drawdown appears to end. In reality, trading performance has not recovered. Without adjustment, drawdown statistics lose meaning.
What Drawdowns Do Not Tell You
Drawdown statistics are indispensable, yet incomplete on their own.
No timing signal. A deep drawdown does not guarantee imminent recovery. It can reflect regime change rather than temporary adversity.
No causality. Drawdown depth does not identify whether losses stem from randomness, model error, excessive leverage, or execution frictions. Diagnosis requires additional analysis.
No direct comparability without context. Cross-strategy comparisons require normalization for leverage, liquidity, and risk factor exposure. The same drawdown can have different meanings in different contexts.
Integrating Drawdowns Into a Risk Framework
Because drawdowns capture peak-to-trough loss, they align naturally with capital preservation goals. Many risk frameworks use them as guardrails or as inputs to capital allocation. A drawdown-aware framework typically includes, as descriptive examples, monitoring of current and historical drawdowns, reviews triggered by threshold breaches, diagnostics to assess whether conditions match known adverse regimes, and consideration of whether exposures remain consistent with stated tolerances. These process elements are meant to create transparency and discipline rather than to prescribe specific trades.
Final Perspective
Drawdowns quantify the cost of being exposed to risk. They convert volatility, leverage, liquidity constraints, and behavioral responses into a single experienced outcome, loss from a prior peak and the time it takes to recover. Measuring drawdowns carefully, interpreting them with context, and integrating them into governance improves the odds of long-term survivability without claiming to eliminate risk. Capital preservation is not about avoiding drawdowns entirely, it is about ensuring that drawdowns remain within ranges that the capital base and operational constraints can withstand.
Key Takeaways
- A drawdown is the peak-to-trough decline of an equity curve, measured most often in percentage terms and evaluated by depth, duration, and recovery.
- Maximum drawdown is informative but sample dependent, and it should be interpreted with context about leverage, liquidity, and market regimes.
- Capital preservation depends on managing drawdown severity and length, because losses are asymmetric and recovery requires larger percentage gains.
- Real-world drawdowns reflect path dependence, leverage, execution frictions, and behavioral pressures, not just abstract return statistics.
- Governance that references drawdowns, including monitoring and pre-defined review thresholds, supports survivability without predicting markets or recommending trades.