Risk management in trading and investing begins with a simple but often neglected reality. A portfolio that does not survive cannot compound. The concept of survivability vs performance formalizes this by framing returns as conditional on avoiding ruin or debilitating drawdowns. It prioritizes the defense of capital so future opportunities remain available, then situates performance within that boundary.
Defining Survivability vs Performance
Survivability refers to the capacity of a trading process to remain solvent, liquid, and operational through adverse market conditions. It encompasses the avoidance of catastrophic drawdowns, the management of leverage, and the ability to meet margin and liquidity demands under stress. Survivability is path dependent. It does not ask only what average return is possible, but whether the journey to that average can be endured financially and operationally.
Performance refers to the realized returns achieved over a given horizon relative to risk taken. It is often summarized with metrics such as compound annual growth, risk-adjusted return ratios, and hit rates. Performance is typically the visible headline measure. Survivability is the condition that allows performance to be realized over time.
The trade-off emerges because any increase in risk that raises expected return also increases the probability or severity of damaging drawdowns. The tension is not absolute. Some improvements in process can raise both survivability and performance by reducing unrewarded risk, for example through better execution, diversification across independent risk sources, or cost control. Beyond those improvements, however, additional return usually requires tolerating greater variance and larger potential losses.
Why Survivability Governs Risk Control
Survivability dominates because capital impairment is nonlinear. A 50 percent loss requires a 100 percent gain to recover. Time is also asymmetric. Extended drawdowns consume calendar time during which capital is not compounding. Liquidity is asymmetric as well. Losses can provoke margin calls or tighten financing precisely when capital is stressed. These asymmetries convert what might look like tolerable volatility on paper into operational fragility.
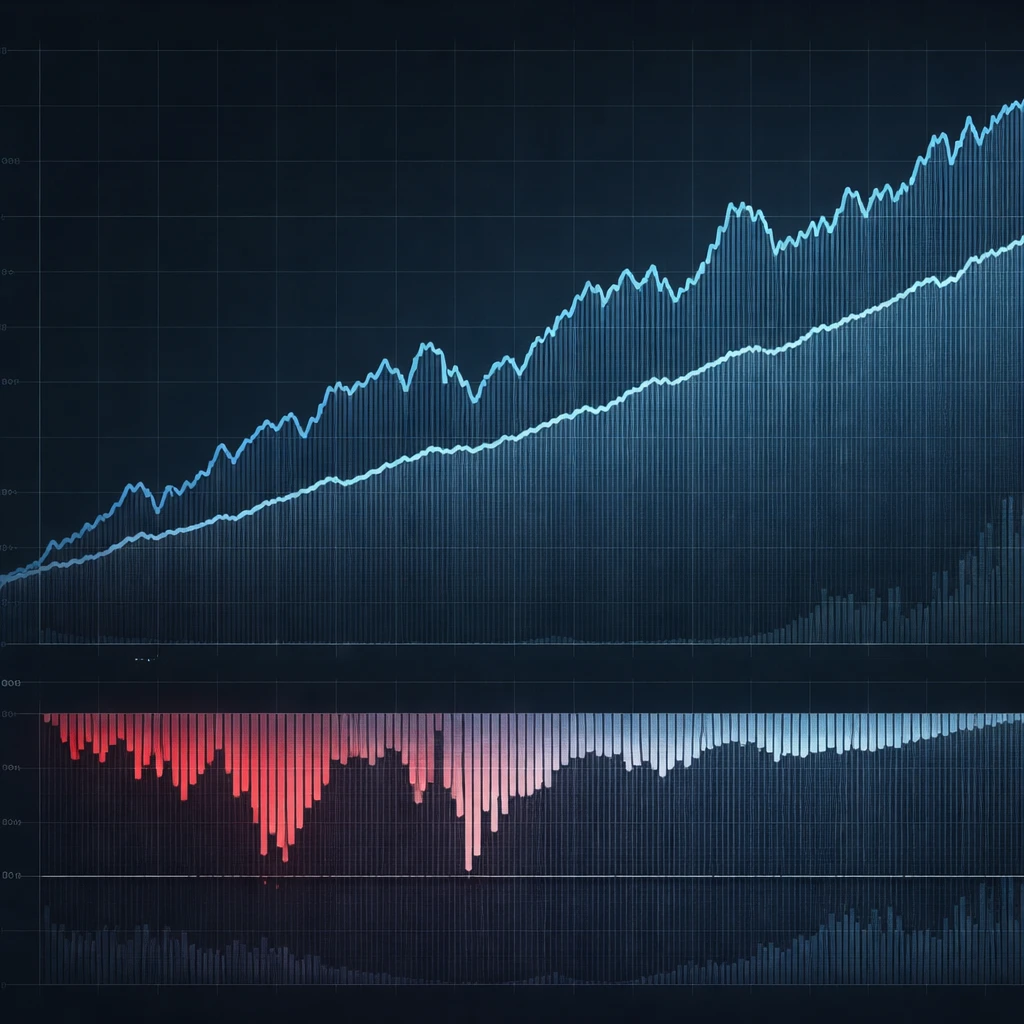
Compounding further tilts the logic toward defense. The geometric mean of returns determines long-run growth. The geometric mean is always lower than the arithmetic mean when variance is positive. This wedge is often called volatility drag. High variance can erase the advantage of a higher arithmetic average if deep losses appear in the sequence. Survivability, by constraining variance and avoiding very large losses, preserves the geometric mean and supports long-run growth even when headline returns appear lower.
Path dependency reinforces the point. Two portfolios with the same average annual return can have very different long-run outcomes if one regularly experiences large drawdowns. If that portfolio also relies on leverage, a severe path can trigger forced deleveraging at exactly the wrong time. The portfolio may then miss the recovery phase or realize it on a smaller capital base. Survivability places structural guardrails around that path, so the process remains intact when conditions are worst.
Drawdowns: Mechanics and Implications
Drawdown measures the percentage decline from a prior peak to a subsequent trough. It is simple, but it encodes several important ideas.
- Recovery math: After a 20 percent drawdown, capital must rise 25 percent to recover. After a 50 percent drawdown, recovery requires 100 percent. The recovery effort grows convexly with the size of the loss.
- Time under water: The duration between the prior peak and a new peak matters for both capital efficiency and behavior. Long recovery periods amplify the psychological and funding pressures that can lead to poor decisions or redemptions.
- Sequence risk: Identical annual averages can conceal very different sequences of gains and losses. Early large losses reduce the base from which later returns compound. Sequence risk matters most when leverage, withdrawals, or contributions interact with returns.
- Liquidity and slippage: Drawdowns tend to occur alongside widening spreads, lower depth, and higher impact. Transaction costs rise just when participants hope to adjust risk, which can worsen realized outcomes relative to models.
Because drawdowns compress capital and time, the survivability lens asks two questions before pursuing higher performance. First, what is the plausible worst case during the holding period given leverage, correlations, and liquidity? Second, is the process designed to remain solvent and operational through that case, with appropriate buffers for uncertainty?
Capital Preservation as a Constraint
Preserving capital does not imply zero risk. It means treating capital at risk as a constrained resource that cannot be lost beyond limits without undermining the process. This constraint can be implemented as hard loss limits, strict leverage caps, or liquidity buffers sized to plausible stress scenarios. The details vary by approach, but the principle is consistent. Set survivability thresholds first, then aim for performance within those boundaries.
Leverage is the most direct channel through which performance ambitions can threaten survivability. Leverage magnifies both gains and losses, but it also introduces the possibility of margin calls and forced liquidation. If collateral values fall quickly, leverage can increase mechanically as the denominator shrinks. Without pre-specified deleveraging protocols, a portfolio can cross from uncomfortable volatility into an exit that crystallizes large losses.
Concentration risk presents a similar challenge. A high-conviction portfolio in a narrow set of positions can look efficient in quiet times. If the shared drivers of those positions deteriorate, losses can materialize simultaneously across holdings. Survivability standards often translate concentration into aggregate risk limits and correlation-aware sizing rather than nominal limits on names alone.
How Survivability vs Performance Appears in Real Trading
Real trading environments surface the trade-off through concrete frictions. The following scenarios illustrate how survivability interacts with performance ambitions. They are not recommendations, but examples of mechanisms.
- Trend-following with leverage: A managed futures approach that uses volatility scaling may target a stable risk level across markets. During extended trends, returns can be strong. In choppy periods, the strategy can experience drawdowns as it repeatedly enters and exits losing trades. If leverage is set too high relative to the worst historical volatility and correlation spikes, a choppy phase can cause a drawdown that forces the manager to cut risk at depressed equity levels. When trends resume, the portfolio participates with less capital. Survivability constraints such as absolute loss limits, caps on gross or net exposure, and liquidity buffers reduce the chance that a rough path causes lasting impairment.
- Concentrated equity selection: A research-driven equity investor might find that the top decile of a ranking model delivered the highest historical returns. A purely performance-driven choice would hold only those names. If the performance of the factor temporarily inverts, the drawdown on a concentrated portfolio can exceed funding or behavioral tolerance. Survivability can be improved by limiting factor concentration, including an allocation to uncorrelated signals, and setting a maximum tolerable peak-to-trough loss at the portfolio level as a hard constraint.
- Short-volatility premium harvesting: Systematically selling volatility can produce steady returns for long periods. The distribution of outcomes usually includes occasional sharp losses when realized volatility spikes. A performance focus might chase higher premium by writing larger size or concentrating in short-dated options. Survivability reframes the decision by asking what loss could occur if volatility triples and correlations rise. Sizing, collateral buffers, and predefined cutoffs for exposure when volatility rises can keep a painful month from becoming an existential event.
- Crypto or FX with high leverage: Many venues offer large notional leverage with small collateral. Performance metrics can look compelling during stable periods. Sudden gaps, exchange outages, or thin liquidity can transform a modest adverse move into liquidation. Survivability has to consider platform risk, gap risk, and funding rate dynamics, not just historical spot volatility.
Across these examples, the survivability principle does not tell the investor what to trade. It structures the risk conversation around loss absorption capacity, time to recovery, and operational continuity.
Measuring and Monitoring Survivability
Survivability becomes operational through measurement. Common metrics include:
- Maximum drawdown: The largest peak-to-trough loss over a period. It summarizes the worst historical experience, with the caveat that the future can be worse.
- Ulcer index and time under water: Measures that capture the depth and duration of drawdowns, not only their magnitude.
- Value at Risk and Expected Shortfall: Loss metrics at specified confidence levels. Expected Shortfall focuses on the average of worst-case outcomes and is more informative for tail awareness than a single quantile.
- Liquidity-adjusted measures: Incorporate spreads, market depth, and expected slippage, which often deteriorate during stress.
- Stress testing and scenario analysis: Hypothetical or historical scenarios that impose shocks to prices, correlations, and liquidity. These include joint moves that exceed typical assumptions.
None of these metrics should be treated as precise forecasts. They are instruments for identifying vulnerabilities, defining tolerances, and confirming that the process remains within its survivability envelope.
Guardrails that Support Capital Preservation
Guardrails formalize survivability in daily practice. They frame limits that trigger predefined adjustments and prevent local decisions from creating global vulnerability.
- Risk budgets and loss limits: A portfolio-level risk budget sets a ceiling on expected variability, while absolute or percentage loss limits halt activity or trigger de-risking once breached. The key is clarity and precommitment.
- Leverage and exposure caps: Caps apply to gross and net exposure, single positions, sectors, and liquidity tiers. Limits should be sensitive to correlation regimes, since correlations often rise in stress.
- Liquidity buffers: Cash or near-cash assets serve as shock absorbers for margin, withdrawals, or rebalancing. Buffers allow time to make decisions deliberately rather than under duress.
- Position exit protocols: Clear rules for reducing or exiting risk when losses reach predefined thresholds. Protocols should consider market impact and the possibility of gaps.
- Operational continuity plans: Backup execution venues, alternative data sources, and communication protocols reduce the chance that a technical failure becomes a trading failure.
Common Misconceptions and Pitfalls
Several recurring misunderstandings can undermine survivability in pursuit of performance.
- Maximizing a backtest ratio equals safety: A high historical Sharpe or profit factor can mask fragility. Regime changes, crowding, and evolving market microstructure can reduce future efficacy. Survivability demands forward-looking worst-case thinking, not only historical optimization.
- Diversification is always sufficient: Diversification across many assets can fail when correlations rise in stress. Effective diversification uses independent sources of return and recognizes that independence is conditional, not permanent.
- Small frequent losses are always safer: A strategy that loses small amounts most days and gains occasionally can still be vulnerable if the rare loss is large enough to threaten capital. The distribution tail matters more than the frequency of gains.
- Drawdown control equals lower return: Reducing unrewarded risk can raise both survivability and performance. Execution improvements, cost control, and removal of weak signals can improve the ratio of return to risk without sacrificing the survivability boundary.
- Ignoring liquidity: Position sizes that are manageable in normal times may be difficult to exit without large impact during stress. Survivability must be assessed at stressed liquidity conditions.
The Psychological Dimension
Even if a portfolio remains solvent, human behavior interacts with drawdowns. Large losses can induce risk aversion at the wrong time or cause abandonment of a process. Survivability and psychology are intertwined. A process that is barely tolerable in theory can fail in practice if periods of loss are too deep or too long for the decision makers and stakeholders involved.
Designing for survivability includes recognizing behavioral thresholds. A drawdown that violates institutional mandates or client expectations can trigger redemptions that force liquidation. An independent trader may have personal risk limits related to household finances. Survivability requires that positional risk, time under water, and communication with stakeholders are aligned.
Simple Math of Trade-offs
Consider two hypothetical strategies over a long horizon. Strategy A targets high nominal return with higher variance. Strategy B targets lower nominal return with much lower variance. Suppose A averages 18 percent arithmetic return with a standard deviation of 30 percent, while B averages 12 percent with a standard deviation of 12 percent. The arithmetic average favors A. The geometric outcome depends heavily on variance and drawdown severity.
If A experiences several 30 to 40 percent drawdowns, the geometric mean can fall well below its arithmetic mean. If B keeps drawdowns around 10 to 15 percent, its geometric mean may be close to its arithmetic mean. Over a decade, B could compound more capital despite the lower headline return. The difference is not automatic. It is driven by the realized path and by whether A ever incurs a loss that demands deleveraging or creates operational obstacles.
Position sizing theory aligns with this intuition. The Kelly criterion, a classic model that maximizes long-run growth for a known edge and variance, often prescribes aggressive sizing. In real markets, parameter uncertainty, fat tails, and estimation error make full Kelly sizing fragile. Many practitioners adopt a fraction of Kelly sizing to retain most of the growth while reducing drawdown risk. The qualitative lesson is broader than Kelly. Uncertainty about edge and correlation argues for restraint to maintain survivability.
Integrating Survivability into Process Design
Embedding survivability begins with a clear statement of risk objectives under uncertainty. It continues with rules that are simple enough to implement reliably under pressure, yet robust enough to capture the major vulnerabilities.
- Define acceptable loss: Specify a maximum peak-to-trough loss that the process must avoid with high probability under stress. Use that as a constraint that shapes sizing choices rather than a soft guideline.
- Align horizon and liquidity: If the investment horizon is months, but positions can only be liquidated over weeks, the survivability boundary will be tight. If positions can be unwound in hours without impact, the system can tolerate a wider range of volatility.
- Model correlation regimes: Stress assumptions should include correlation spikes. Survivability needs to hold when formerly independent positions move together.
- Account for costs under stress: Execution costs, spreads, and financing can become material. Backtests that assume normal costs tend to overstate performance and survivability.
- Create decision triggers: Predefine the actions that occur at certain loss levels, exposure thresholds, or liquidity signals. Triggers reduce the risk of hesitation or overreaction.
Drawdowns as Information, Not Only Pain
Drawdowns are also diagnostic. Persistent or deeper-than-expected losses are a source of feedback about edge quality, signal decay, or changing market structure. A survivability mindset uses drawdowns to update beliefs about the strategy without abandoning the discipline of risk limits. This perspective treats performance within the survivability boundary as a test of the process rather than a referendum on a single period.
Evaluating drawdowns asks whether the losses align with the documented scenario set. If not, the process may be underestimating a risk or missing a dependency. Post-drawdown reviews can lead to improvements that enhance both survivability and performance, such as refining entry and exit logic to reduce exposure during unfavorable regimes or improving capital efficiency through cost-aware execution. The crucial point is that changes follow evidence and maintain the boundary conditions that protect capital.
Case Study Style Illustrations
Example 1: A volatility targeting equity portfolio
An equity portfolio targets 10 percent annualized volatility through dynamic sizing. During a low-volatility regime, it increases exposure to maintain the target. A sudden volatility shock produces a 15 percent drawdown as correlations rise and the equity market falls. Survivability depends on whether the portfolio had a maximum loss limit and a plan for reducing exposure when realized volatility jumps. If exposure was high due to pre-shock calm, the drawdown could exceed expectations. A survivability-first design incorporates a volatility floor that prevents leverage from rising too much in quiet periods, caps exposure when implied or realized volatility spikes, and maintains a liquidity buffer to rebalance without forced liquidation.
Example 2: A multi-asset allocation with tail hedges
A diversified allocation holds equities, rates, credit, and commodities. Under moderate conditions, it achieves steady returns with manageable drawdowns. In a crisis, correlations rise sharply. The portfolio relies on diversification for survivability, which is insufficient in this regime. An explicit tail-risk budget adds instruments whose payoffs are convex in downturns, such as long volatility exposures. The cost of these exposures can reduce average returns. The survivability lens evaluates whether the reduction in drawdown and time under water justifies the cost, given the objective of protecting the capital base for future compounding.
Example 3: A statistical arbitrage strategy with capacity limits
A market-neutral approach profits from small mispricings across many names. Returns are smoothed by diversification across hundreds of pairs. During a liquidity shock, spreads widen and exit costs rise. The strategy remains roughly market neutral, but losses occur due to mark-to-market moves and the cost of unwinding positions to meet redemptions. Survivability here is less about market direction and more about liquidity and funding risk. Position sizes that were acceptable under normal conditions prove too large when turnover and impact increase simultaneously. Hard capacity limits and conservative assumptions about liquidation costs can preserve the ability to adjust without crystallizing excessive losses.
Documentation and Governance
Survivability benefits from explicit documentation. A risk policy defines acceptable loss thresholds, leverage and concentration caps, liquidity assumptions, and the procedures for stress testing. A governance routine reviews breaches, investigates near misses, and updates assumptions when market structure changes. Documentation creates a record that can be tested against reality. It reduces the tendency to adjust risk limits reactively, which can increase volatility of decision making precisely when markets are volatile.
Simple routines reinforce governance. Regular calculation of drawdown statistics, time under water, and realized versus expected risk reveals whether the process behaves as designed. Deviations should be explained and either corrected or documented as benign. The goal is not to eliminate drawdowns, which is impossible, but to keep them within tolerances and consistent with the process logic.
Concluding Perspective
Survivability vs performance is not a slogan. It is a practical ordering of priorities for any process that aspires to compound capital through uncertainty. Survivability defines the boundary within which performance can be pursued. It integrates drawdown control, leverage discipline, liquidity awareness, and behavioral tolerance. Performance then emerges as the outcome of a process that stays in the game long enough to allow statistical edge and careful design to manifest. The discipline to respect survivability is itself a source of long-run performance because it protects the compounding engine from the interruptions that permanently impair capital.
Key Takeaways
- Survivability sets the boundary for performance by preventing losses that permanently impair the ability to compound.
- Drawdowns are asymmetric in both math and behavior, which makes their size and duration central to risk control.
- Leverage, concentration, and liquidity are the practical channels through which performance goals can threaten survivability.
- Measurement and guardrails translate survivability into daily practice through limits, buffers, and predefined actions.
- Process discipline that respects survivability can improve long-run performance by preserving the geometric compounding path.