Drawdowns are an unavoidable part of trading and investing. Every approach with real risk will, at times, decline from a prior equity peak before finding its footing again. Recovering from drawdowns is the discipline of managing that decline and the subsequent climb back to new highs while preserving capital and decision quality. This topic sits at the heart of risk control because it links arithmetic, time, volatility, liquidity, and human behavior into a single practical question: after losses, what makes recovery plausible and sustainable without exposing the account to ruinous risks?
What Recovering From Drawdowns Means
A drawdown is the percentage decline from an equity peak to a subsequent trough. Recovery is the process of returning from that trough to the prior peak, and eventually to a higher watermark. Two simple measures frame the discussion:
- Maximum drawdown: the largest peak-to-trough loss observed over a period.
- Time under water: the time it takes to recover from a drawdown and make a new equity high.
Recovering from drawdowns is not only about profits after a loss. It is about maintaining the ability to continue participating. Preservation of capital, and preservation of the decision process that generates returns, are both essential. A trader who survives to the next favorable period has a chance to realize the long-run edge of a sound approach. A trader who exhausts capital or becomes impaired by stress and forced liquidations does not.
Why Recovery Is Central to Risk Control
Capital declines create asymmetry. Losses and gains do not offset one for one. A 10 percent loss requires an 11.1 percent gain to recover. A 20 percent loss requires 25 percent. A 50 percent loss requires 100 percent. An 80 percent loss requires 400 percent. This asymmetry exists because the base for compounding shrinks when you lose. As the drawdown deepens, the percentage return required to recover rises faster than linearly.
That asymmetry forces risk discipline. If drawdowns are limited, the recovery threshold remains manageable, both statistically and psychologically. If drawdowns are allowed to grow, the recovery path may become infeasible within realistic time horizons or under realistic volatility constraints. In other words, recovery is not guaranteed by future returns. It is made fragile by deep losses, long time under water, and the potential for adverse market regimes to persist.
The Arithmetic of Drawdowns and Recovery
The core identity is straightforward. If the account declines by D percent, the new capital is (1 − D) times the peak. To return to the peak, the required return R satisfies (1 − D) × (1 + R) = 1. Solving gives R = D ÷ (1 − D). This ratio is the recovery hurdle.
Practical implications follow:
- Recovery thresholds rise sharply once losses exceed roughly 20 to 30 percent. The account enters a region where average returns that might be reasonable in quiet periods struggle against higher volatility and slippage during stress.
- Compounding is geometric. The sequence of returns matters. Two paths with the same average arithmetic return can produce different terminal wealth if volatility differs. This volatility drag increases the difficulty of climbing out of a drawdown.
- Even small incremental costs, such as commissions, financing, slippage, and adverse selection, compound against recovery during extended underperformance.
Time to Recovery and Path Dependence
Time under water is a second dimension of the problem. A 20 percent drawdown that recovers in one month presents different psychological and operational challenges than the same drawdown that persists for a year. The expected time to recovery depends on the long-run drift of the process, the variability of returns, and the dependence structure between returns and volatility.
Conceptually, two effects are critical:
- Volatility drag: Higher volatility reduces geometric growth for a given average arithmetic return. In the presence of elevated volatility, the expected time to return to the prior peak increases.
- Path dependence: The order of gains and losses matters. A string of small gains followed by a large loss can set recovery back substantially, even if the average return is unchanged. Clusters of losses are common during regime shifts, which extends time under water.
Because you cannot know the future path, prudent risk control treats the recovery window as uncertain. Planning for uncertainty favors containment of drawdowns, rather than reliance on rapid rebounds that may not materialize when needed.
How Recovery Plays Out in Practice
Different trading styles experience drawdowns differently, yet the logic of recovery is shared. Consider three stylized scenarios used to illustrate mechanics rather than prescribe tactics:
- Short-horizon, high-turnover approach: A sequence of small losses and increased intraday volatility pushes the strategy into a 12 percent drawdown over two weeks. Liquidity remains adequate, but slippage rises following news events. The recovery path depends on stabilizing win rate and controlling variability. Trying to accelerate recovery through larger position sizes after losses can backfire if volatility remains high, turning a manageable drawdown into a larger one.
- Medium-horizon trend follower: A regime change produces rapid reversals that whipsaw entries and exits across several instruments. The strategy is down 18 percent. Recovery relies on the eventual reemergence of directional opportunities and controlling exposure during chop. Recovery may be gradual, and the time under water can be longer than usual, even if the strategy is sound over a full cycle.
- Yield-focused mean reversion: A sudden shock widens spreads and impairs liquidity. Mark-to-market drawdown hits 25 percent, with realized losses compounded by gap risk. Recovery depends not only on the next set of mean-reversion opportunities but also on the ability to transact without incurring excessive costs. In stressed liquidity, the path back can be slow even if signals remain valid.
These examples underscore a recurring theme. Recovery is not solely about signal quality. It is intertwined with trade sizing, volatility, transaction costs, and liquidity conditions that may change precisely when recovery is most needed.
Common Misconceptions
Several beliefs hinder effective recovery planning:
- Symmetry myth: Many assume that a 20 percent loss can be offset by a subsequent 20 percent gain. The earlier arithmetic shows why this is false. Recovery hurdles get steeper as losses deepen.
- Martingale logic: The idea that increasing size after losses guarantees recovery ignores finite capital, margin constraints, and adverse serial correlation in losses. It also increases the probability of large drawdowns or ruin during streaks.
- High win rate equals easy recovery: A high win rate strategy can still suffer large drawdowns if its losers are fat-tailed or if it sells volatility implicitly. Recovery after a rare large loss can be slow, because the average gain per trade may be small while losses are lumpy.
- Diversification always protects: Correlations tend to rise during stress. Instruments that appear diversified in calm markets can become highly correlated, deepening drawdowns and lengthening recovery.
- Backtest recovery times are reliable: Historical recovery speeds are not promises. Live costs, slippage, and structural market changes can make actual recovery longer and harder.
Volatility, Leverage, and the Probability of Survival
Leverage accelerates both compounding and the path to large losses. For a given edge, higher leverage increases the chance that adverse variance produces a deep drawdown before the long-run average can assert itself. The relationship between variance and survival is nontrivial. Two strategies with the same expected return can have very different odds of reaching a fixed loss threshold due to different volatilities and tail risks.
Classic results from betting theory show that the growth rate of capital is sensitive to estimation error in edge and variance. Aggressive sizing based on overestimated edge or underestimated volatility frequently yields deep drawdowns. Conservative sizing reduces the expected growth rate but also lowers the probability of large losses that endanger recovery. While there is no universally correct level, awareness of this trade-off is essential for thinking clearly about recoverability.
Liquidity, Slippage, and Gap Risk During Recovery
Recovery is often attempted during stressed conditions. Spreads widen, market depth thins, and order book resilience declines. Three operational effects become meaningful:
- Higher transaction costs: Elevated slippage reduces net returns, stretching the time to recovery. Signals that were profitable under normal costs can struggle when costs spike.
- Impact and capacity: As size approaches market capacity, incremental trades move prices more, worsening fills and slowing recovery. Under pressure, the temptation to force entries or exits can worsen impact.
- Gap risk and forced liquidation: Overnight moves or event risk can bypass stop levels and produce larger-than-planned losses, deepening the drawdown. Margin calls can force exits at unfavorable prices, locking in losses and truncating the recovery path.
Because these frictions are cyclical, a recovery plan that seemed feasible in quiet markets may prove optimistic during stress. Integrating cost and capacity realism into expectations is part of prudent capital preservation.
Measuring, Monitoring, and Responding to Drawdowns
Consistent measurement provides the context for responsible decisions. Useful elements include:
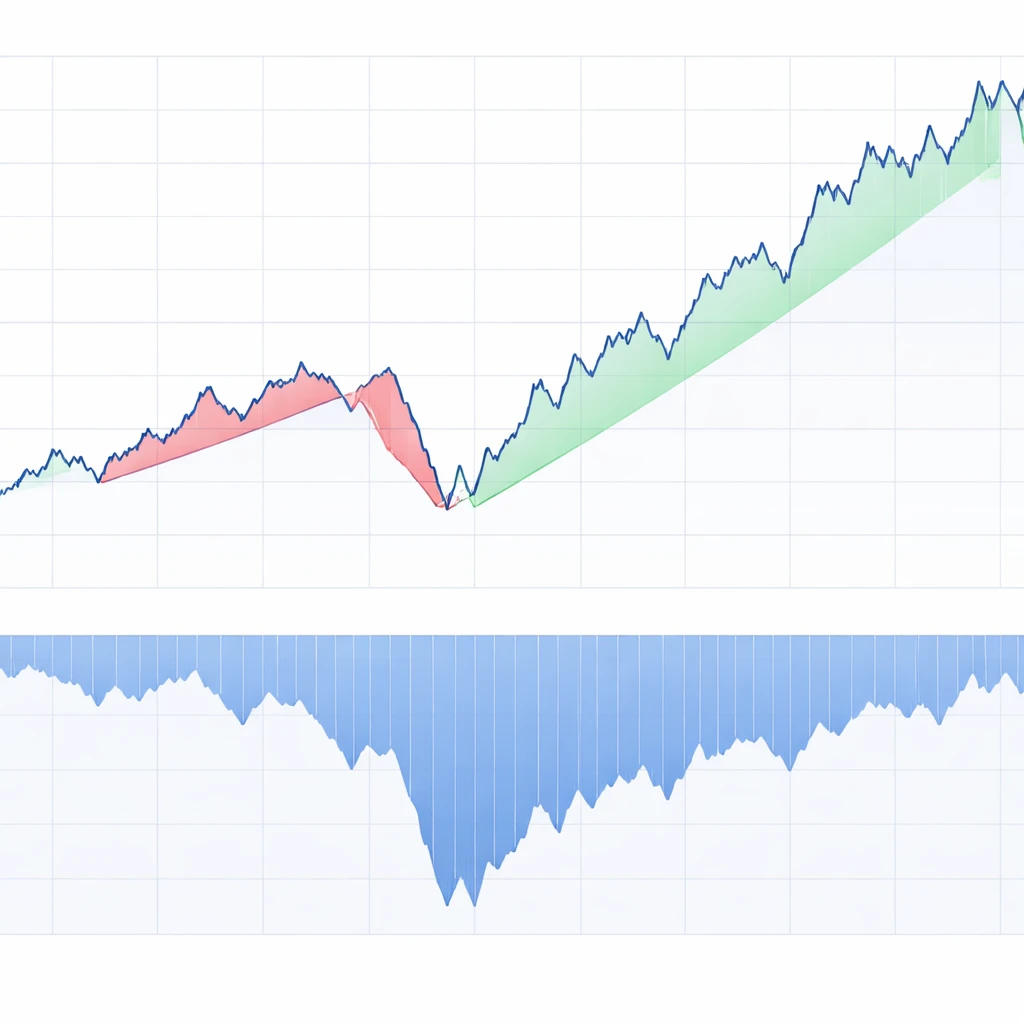
- Underwater curves: Visualizing percentage distance from peak highlights the frequency and depth of drawdowns, and the time under water between peaks.
- Rolling statistics: Rolling volatility, rolling Sharpe-like ratios, and rolling hit rates reveal whether deterioration is cyclical or structural. A persistent decline across multiple measures can signal regime change or model drift.
- Tail metrics: Value at Risk and Expected Shortfall estimates, calibrated conservatively, help gauge potential capital impairment under stress, while acknowledging model uncertainty.
- Attribution: Breaking drawdown into sources, such as instrument, time of day, or signal family, supports targeted adjustments that can improve recoverability without wholesale overhaul.
How to respond is context specific, but the goal remains constant. Preserve the ability to continue operating while avoiding actions that magnify fragility, such as impulsive size increases, concentration into correlated risks, or trading outside tested conditions.
Psychological Dynamics That Affect Recovery
Drawdowns stress attention, memory, and judgment. Several biases can interfere with recovery:
- Sunk cost bias: The desire to recoup recent losses from the same instruments or tactics can promote poor selectivity and excess risk taking.
- Loss chasing: Increasing activity or size to feel productive can increase variance without improving edge.
- Recency bias: Overweighting the latest losses can cause abandonment of a viable approach at the worst moment. The opposite mistake, stubbornly ignoring new information, is also dangerous.
- Process erosion: Fatigue and stress reduce adherence to rules that protect capital. Error rates often rise during drawdowns, compounding the difficulty of recovery.
A structured routine that maintains process quality, record keeping, and pre-defined playbooks for stress events can help reduce unforced errors. The objective is to protect the decision engine that generates returns.
Practical Examples of Recovery Math
Consider a simple capital path to illustrate magnitudes, not to prescribe any particular action. Suppose an account at 100 declines by 25 percent to 75. The recovery hurdle is 25 ÷ 75, which equals 33.3 percent. If the approach historically generates about 1 percent per month with 5 percent monthly volatility, the expected time to break even is uncertain and likely lengthy. Variability means some paths will recover faster, while others will remain under water for much longer.
Contrast that with a smaller drawdown. From 100 to 90, the required return is 11.1 percent. In this case, a moderate sequence of gains could recover the loss within a more tractable time window, even with the same average return profile. The difference between a 10 percent and a 25 percent drawdown is disproportionate in terms of recovery feasibility.
Now consider the hazard of trying to accelerate recovery by significantly increasing exposure following a loss. If variability doubles due to larger positions in a volatile period, the probability of encountering a further 10 to 15 percent drawdown before recovery rises materially. What initially appeared to be a short path back can turn into a deeper trough that requires a much larger subsequent gain. This is how recovery plans fail in practice.
Diversification, Correlation, and Recovery Speed
Diversification can reduce drawdown depth when underlying risks are truly distinct. However, correlation structures are dynamic. During stress, many assets and strategies move together. For recovery planning, two observations matter:
- Low average correlation is beneficial, but low correlation in calm markets does not guarantee low correlation when drawdowns occur.
- Concentration in a single source of edge can create clustered losses that are difficult to recover if the regime that supports the edge disappears for a time.
Monitoring correlation shifts and exposure concentrations helps align expectations for recovery time with current conditions. It can also inform whether a drawdown is idiosyncratic or systemic to the approach.
Structural Breaks and Model Risk
Not all drawdowns are created equal. Some reflect routine variability around a stable process. Others arise from structural breaks, where the relationship that generated profits changes or vanishes. Recovery after a structural break is often slow or does not occur without modification of the process. Clues that a drawdown may be structural include:
- Signal performance deteriorates across multiple instruments and time segments without corresponding improvement elsewhere.
- Transaction costs or liquidity conditions have shifted in a way that permanently alters net profitability.
- New market participants or regulatory changes have changed the opportunity set.
Distinguishing noise from structural change is difficult in real time. A disciplined diagnostic framework that balances statistical evidence with domain knowledge can reduce the risk of compounding losses while waiting for a recovery that relies on a regime that has ended.
Capital Preservation During and After Drawdowns
Preservation underpins recovery. Several principles, framed as considerations rather than prescriptions, are widely used by practitioners to protect the ability to continue:
- Risk budgets: Many teams express exposure in risk units and constrain aggregate risk to align with tolerable drawdowns. The purpose is to avoid exceeding a loss magnitude that would make recovery impractical.
- Exposure discipline under uncertainty: When signals weaken or variance rises, some practitioners reduce concentration and avoid stacking correlated exposures that can produce sudden large losses.
- Liquidity awareness: Sizing and order tactics are adapted to prevailing liquidity to limit impact and slippage, especially during stress when costs rise.
- Operational resilience: Error reduction, robust execution, and redundancy matter most during drawdowns, because operational errors compound at exactly the wrong time.
These practices do not guarantee recovery. They aim to keep the drawdown within bounds that allow the underlying process, if sound, to work over time.
Setting Expectations for Recovery
Expectations shape decisions during stress. Reasonable expectations consider three uncertainties:
- Return uncertainty: Long-run averages are not promises over any particular month or quarter. Recovery can be slower than historical data suggest.
- Cost and capacity uncertainty: In stressed markets, transaction costs and market impact increase, degrading the net performance that powers recovery.
- Model uncertainty: The true edge may be smaller than measured historically. Overconfidence about edge size often leads to overexposure and deeper drawdowns.
Setting expectations too optimistically increases the temptation to take actions that might backfire. Conservative assumptions about speed and ease of recovery are a form of capital protection.
Case-Style Illustration of Recovery Choices
Imagine two operators facing a 20 percent drawdown from 100 to 80. Operator A keeps risk consistent with historical parameters and experiences monthly returns that fluctuate around a modest positive drift with meaningful volatility. After several months, the account hovers between 82 and 88, with occasional pullbacks. The recovery is slow but stable, and there are no impairment events such as margin calls or liquidity shocks.
Operator B attempts to recover faster by doubling average exposure during a period of elevated volatility. Early gains push the account from 80 to 86, but an adverse gap and slippage drop it to 72. The new recovery hurdle rises from 25 percent to about 38.9 percent, and the psychological burden becomes heavier. The ability to make disciplined decisions deteriorates. This trajectory is common when recovery is pursued through greater variance rather than through process quality.
Neither path guarantees success, but the example highlights how choices about exposure interact with volatility and the recovery math. The deeper the trough, the taller the hill.
Planning for Drawdowns Before They Occur
Planning is easier before stress arrives. Many professionals document a drawdown policy that anticipates the metrics they will monitor, the diagnostic checks they will run, and the operational behaviors they will tighten during stress. The intent is to reduce ad hoc reactions. While details vary, the structure typically includes:
- Thresholds for heightened review, based on percentage drawdown or deterioration in key statistics.
- Predefined diagnostic steps, such as rechecking data integrity, execution quality, and cost assumptions.
- Clarity about the signs of structural change that would trigger deeper investigation or a temporary halt for analysis.
Such planning does not eliminate drawdowns. It reduces the risk that unforced errors lengthen or deepen them.
Rebuilding After a Severe Drawdown
Severe drawdowns change the risk landscape. Confidence declines, and the tolerance for further losses narrows. Rebuilding often involves several elements:
- Reduced variance: Operators frequently target lower portfolio variance to stabilize compounding. This can be achieved in many ways, such as reducing concentration or avoiding marginal signals during uncertainty.
- Process sharpening: Tightening execution, narrowing entry criteria, and improving error controls are practical levers that support recovery without relying on larger size.
- Incremental validation: Small, well-measured successes can help restore process confidence. This is a psychological benefit, but it also reduces the risk of large mistakes stemming from frustration.
Rebuilding is not linear. There will be setbacks. The objective is to restore the conditions under which the original edge, if still present, can express itself.
The Role of Patience and Selectivity
Patience is not passive. It reflects the discipline to wait for conditions where the approach has historically operated effectively, rather than forcing trades in unsuitable environments. Selectivity means choosing among opportunities with an eye toward how they affect variance and correlation, not only expected return. Both qualities shorten expected time under water by avoiding additional large losses when capital and psychological bandwidth are most fragile.
Putting It All Together
Recovering from drawdowns sits at the intersection of arithmetic, uncertainty, and human factors. The arithmetic tells us that deeper losses raise the required return to get back to even. Uncertainty reminds us that average outcomes are not promises and that volatility, costs, and correlation can change precisely when recovery is attempted. Human factors determine whether process quality holds under stress or degrades into behaviors that amplify risk.
Capital preservation is the unifying thread. By treating drawdowns as constraints to be managed rather than inconveniences to be erased quickly, one protects the ability to continue operating through varied market regimes. That ability is the foundation of long-term survivability.
Key Takeaways
- Losses and gains are asymmetric, so deeper drawdowns require disproportionately larger gains to recover.
- Time under water depends on drift, volatility, costs, and path dependence, all of which can worsen during stress.
- Recovery efforts that raise variance often backfire by increasing the probability of a deeper trough.
- Monitoring underwater curves, rolling metrics, and correlations supports disciplined responses and early detection of structural change.
- Capital preservation, process quality, and conservative expectations improve the odds of reaching new highs without taking ruinous risks.