Risk and return sit at the center of portfolio construction. Every allocation choice implicitly trades one for the other. Higher expected returns typically come with higher uncertainty in outcomes, while lower-risk positions tend to limit both downside and upside. Understanding this tradeoff at the portfolio level helps investors design allocations that are resilient across market conditions and realistic about long-term capital planning. The goal is not to chase the highest return or to minimize risk blindly. The aim is to balance the two in a way that is coherent with constraints, objectives, and the realities of market behavior.
Defining the Risk vs Return Tradeoff
At its core, the risk vs return tradeoff states that assets with higher expected returns usually display greater variability in realized outcomes. In portfolio construction, risk is not a single concept. It encompasses several dimensions:
- Volatility: The variability of returns. Commonly measured by standard deviation, it provides a first-pass gauge of uncertainty but does not distinguish between upside and downside.
- Downside risk: The tendency for returns to fall below a threshold. Metrics include downside deviation, value at risk, and expected shortfall. These measures emphasize the asymmetry that matters to capital preservation.
- Drawdown: The magnitude and duration of peak-to-trough declines. Drawdown is a path-dependent measure and often more intuitive from a capital planning perspective.
- Liquidity risk: The possibility that assets cannot be sold or rebalanced at fair prices, especially during stress when liquidity evaporates.
- Inflation risk: The risk that nominal returns fail to protect purchasing power.
- Tracking risk: The risk of deviating from a reference benchmark or liability stream, relevant for investors managing against specific obligations.
Return, for portfolio purposes, is generally measured as an expected annualized rate, either nominal or real. Nominal returns do not account for inflation, while real returns adjust for purchasing power. The relation between risk and return is not guaranteed in any single period. It is a probabilistic link supported by the idea that risk exposures earn compensation over time, though realized outcomes can deviate substantially from expectations.
Why the Tradeoff Matters for Long-Term Capital Planning
Long-term plans depend on both the level and the reliability of returns. Capital projects, retirement spending, endowment payouts, and intergenerational transfers require a view of how wealth might evolve under uncertainty. The risk vs return tradeoff informs that plan in three ways:
- Feasibility: Expected return assumptions must align with realistic risk acceptance. Attempting to meet an aggressive return target without accepting higher risk creates a mismatch likely to disappoint.
- Resilience: Drawdowns and extended recoveries can derail plans even when long-run averages look acceptable. Managing downside characteristics helps preserve the ability to stay invested through adverse periods.
- Purchasing power: Real outcomes matter for long horizons. A nominal return that fails to outpace inflation does not meet long-term spending objectives.
Two additional considerations often shape long-horizon allocations. First, sequence risk means the order of returns can matter as much as the average. Early losses can be more damaging when withdrawals or commitments occur concurrently. Second, compounding of volatility implies that higher dispersion reduces the geometric growth rate relative to the arithmetic average. Balancing return potential against these features is at the heart of prudent asset allocation.
The Portfolio-Level View: Diversification and Correlation
At the portfolio level, the risk vs return tradeoff is governed by how assets interact. Correlation is the key link. When assets do not move in lockstep, combining them can reduce overall volatility relative to the average of their individual volatilities. This diversification effect allows a portfolio to pursue a given expected return with less total risk, or a higher expected return for the same risk, subject to the availability of low or negative correlations.
A simple example illustrates the principle. Suppose Asset A has an expected return of 7 percent with 15 percent volatility, and Asset B has an expected return of 3 percent with 5 percent volatility. If their correlation is 0.1, a portfolio that mixes the two can achieve a volatility below the weighted average of 15 and 5 percent. The expected return is just the weighted average of the two expected returns, but the variance reflects the correlation structure. This is the quantitative heart of diversification.
Correlations are not fixed. They vary over time and can rise during stress, which reduces diversification when it is most needed. Asset allocation therefore relies on both average relationships and an understanding of regimes when correlations change. Portfolios that appear diversified in calm conditions may behave more uniformly in crises, exposing the investor to concentrated risk they did not recognize.
Expected Return: Sources and Uncertainty
Expected returns arise from risk premia and cash flow characteristics. Broadly:
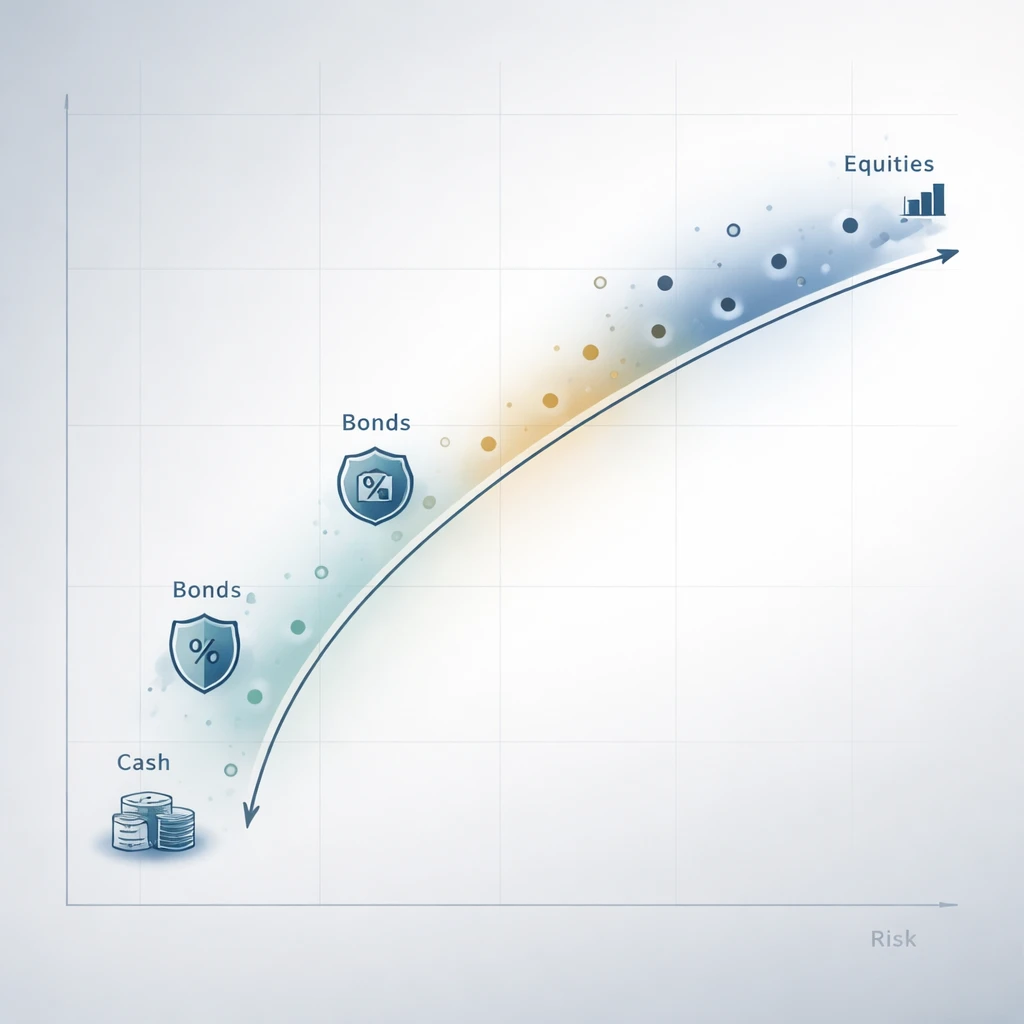
- Equities: Compensation for bearing business risk. Expectations depend on earnings growth, valuations, and payout policies. Historical averages in developed markets have been positive over long horizons with high dispersion in shorter windows.
- Bonds: Starting yield is a strong predictor of long-term nominal bond returns, adjusted by duration effects and credit risk where applicable.
- Real assets: Real estate, infrastructure, and commodities have return drivers tied to rents, regulated cash flows, or supply-demand dynamics. Some provide partial inflation linkage.
- Cash and short-term instruments: Lower expected returns with lower volatility, often used for liquidity needs and near-term commitments.
- Style and factor exposures: Value, size, quality, momentum, and low volatility are examples of systematic characteristics that have earned premia in some periods. Realization is cyclical and uncertain.
Despite well-known patterns, expected returns are estimates with wide confidence intervals. Relying on a single point forecast is fragile. Portfolio construction often benefits from ranges, scenario analysis, and sensitivity testing to gauge how allocations might behave under different assumptions.
From Assets to Portfolios: The Efficient Frontier Intuition
The efficient frontier is a conceptual tool that ranks portfolios by expected return and risk given an opportunity set and a correlation structure. It encapsulates tradeoffs by showing combinations where no other portfolio offers higher expected return for the same risk or lower risk for the same expected return. The frontier shifts when inputs change, which they often do. The frontier is not a prescription. It is a map that illustrates how diversification can improve the return-to-risk relationship compared with naive allocations that ignore covariance.
Practical implementation must account for model error, non-normal returns, and constraints such as liquidity, concentration limits, or regulatory requirements. These real-world elements cause portfolios to deviate from idealized frontier points, but the underlying intuition remains useful. The challenge is to harvest the benefits of diversification while respecting uncertainties in the inputs.
Risk Budgeting and Risk Contributions
Allocations are often expressed in capital weights, but risk is not proportional to capital. A 10 percent position in a volatile asset can dominate portfolio risk, while a larger weight in a stable asset might contribute less. Risk budgeting reframes the problem by assigning a portion of total portfolio risk to each asset or factor and then choosing capital weights to align with those risk budgets.
Risk contributions depend on both an asset’s volatility and its correlation with the rest of the portfolio. An asset with moderate volatility but high correlation to dominant holdings can still contribute significantly to total risk. Conversely, an asset with higher standalone volatility may contribute less if its correlation is low. Understanding marginal contributions to risk helps prevent unintended concentration.
Illustrative Portfolios in Real-World Context
To ground the tradeoff, consider three stylized allocations that have appeared in institutional practice. These are not recommendations. They serve to illustrate how choices alter risk and return characteristics.
- Capital preservation tilt: A portfolio with a high share in high-quality bonds and cash, supplemented by a modest equity allocation. Volatility is lower relative to equity-heavy portfolios. Expected returns are anchored by yields and limited equity risk premia. Drawdowns occur, particularly when rates rise sharply or when credit spreads widen, but are typically shallower than equity-led declines.
- Balanced mix: A diversified allocation across global equities, investment-grade bonds, and a sleeve of real assets. The aim is not to split capital mechanically but to combine assets with different risk drivers. Historically, such mixes have experienced material drawdowns in recessions or inflation shocks, yet the presence of lower-correlation assets can moderate total volatility compared with equity-only exposure.
- Growth tilt: A portfolio with a higher allocation to equities and growth-oriented real assets. Expected returns are higher in benign or expansionary regimes. Volatility and drawdown potential are also higher. The distribution of outcomes is wider, which increases the importance of time horizon and interim spending needs.
Over long periods, historical data in developed markets show that equity-heavy portfolios have earned higher average nominal returns than bond-heavy portfolios, accompanied by larger drawdowns and greater year-to-year variability. For example, a 60 percent equity and 40 percent bond mix in the United States has experienced multiple drawdowns exceeding 20 percent during major crises. In 2022, both stocks and bonds declined together as inflation and rate hikes raised correlations, demonstrating that diversification benefits can weaken in certain regimes. Such episodes underscore that a static view of the tradeoff is incomplete without attention to macro conditions and correlation shifts.
Time Horizon, Compounding, and Path Dependence
Time horizon shapes risk capacity. In principle, longer horizons allow more time for recovery from adverse outcomes, which can support exposure to higher-volatility assets. In practice, the horizon is linked to cash flow needs, spending rules, and psychological tolerance for drawdowns. Compounding also matters. Geometric returns are pulled down by volatility due to the arithmetic-geometric gap. A sequence of returns with the same average but higher dispersion yields a lower compounded outcome. Controlling extreme losses and volatility can therefore improve the probability of meeting long-horizon objectives even if average expected return is unchanged.
Path dependence arises when withdrawals or contributions occur. With ongoing withdrawals, early losses can reduce the capital base so that later gains apply to a smaller pool. This does not argue for any particular allocation. It argues for recognizing that the risk vs return tradeoff must be appraised in the context of cash flow timing, not just average returns.
Inflation, Real Returns, and Liability Awareness
Real outcomes matter for long-term resilience. Inflation erodes purchasing power and can alter correlations across assets. Nominal bonds, for instance, can suffer when inflation surprises to the upside, while certain real assets may partially offset the impact. Inflation-linked securities are designed to address purchasing power risk directly in specific markets, though they carry their own term and liquidity considerations.
Many long-horizon investors are effectively managing against liabilities. Universities, pensions, and foundations often reference spending rules or benefit schedules. Households manage against future consumption needs. Liability-aware portfolios pay attention to duration, inflation sensitivity, and cash flow timing. Aligning the interest rate and inflation characteristics of assets with those of liabilities can reduce tracking risk relative to the obligations that matter.
Stress Testing and Scenario Analysis
Because the tradeoff is probabilistic, forward-looking analysis is essential. Historical data provide context, but they are an imperfect guide. Stress testing and scenario analysis explore how portfolios might behave under adverse or unusual conditions such as stagflation, rapid rate hikes, credit crises, or sharp growth shocks. These exercises highlight nonlinearity, such as convexity in bonds, option-like exposures, or liquidity dynamics. They also reveal where diversification may fail and where risk concentrations reside.
Robust scenario work often combines history-based shocks, hypothetical macro paths, and factor-driven models. The objective is not to forecast precisely, but to understand vulnerabilities and to gauge whether the portfolio’s risk profile is consistent with its intended purpose under a range of plausible conditions.
Costs, Taxes, and Frictions
Risk and return exist net of frictions. Management fees, trading costs, and taxes can materially alter realized outcomes, particularly for strategies with high turnover. In taxable contexts, the timing of gains and losses, the distinction between short-term and long-term rates, and the use of tax-efficient instruments can change the effective return distribution. Frictions are not just a drag on return. They can interact with risk by limiting rebalancing or constraining access to certain assets during stress.
Rebalancing and Drift Management
Even a carefully calibrated allocation drifts as assets move differently. Rebalancing restores intended risk exposures. It is not costless. Trading incurs fees, potential taxes, and sometimes market impact. Rebalancing also interacts with the risk vs return tradeoff by implicitly selling recent winners and buying laggards, which can reduce concentration and volatility. The frequency and tolerance bands used in rebalancing affect both risk and net returns in ways that are specific to the asset mix and the cost structure.
Static vs Adaptive Allocation
Static allocations assume stable expectations. Adaptive allocations allow parameters such as expected returns, volatilities, and correlations to vary over time. Adaptive approaches might update inputs using moving windows, Bayesian methods, or macro signals. The benefit is responsiveness to changing conditions. The cost is model risk and the danger of reacting to noise. Whether static or adaptive, the central question remains the same: what level of risk is acceptable for the expected reward, given the possibility that relationships will shift?
Factor Exposures and Hidden Bets
Portfolios often hold diversified lists of securities yet share common factor exposures. Equity portfolios can be dominated by growth or value characteristics even if sector allocations look dispersed. Multi-asset portfolios often concentrate in equity beta through various sleeves that correlate with risk-on behavior. Mapping holdings to factors such as size, quality, duration, credit, inflation sensitivity, or currency helps clarify where the portfolio is taking risk. This mapping links directly back to the risk budget and highlights whether the intended tradeoff is actually being implemented.
Liquidity Tiers and Cash Flow Alignment
Liquidity is a risk dimension with direct practical implications. Portfolios that include private assets, thinly traded credits, or real assets may promise diversification and different return drivers, but they also restrict the ability to rebalance or meet cash needs during stress. A liquidity tiering framework partitions assets by how quickly they can be converted to cash at reasonable cost. Aligning liquidity supply with liquidity demand reduces the probability that desirable long-term positions must be sold at inopportune times.
Common Pitfalls in Balancing Risk and Return
Several recurring errors can undermine the tradeoff:
- Chasing past performance: Extrapolating recent winners often leads to concentration in crowded exposures at unfavorable valuations.
- Ignoring correlations: Focusing on standalone volatility without considering covariance can produce portfolios that are diversified in name only.
- Underestimating tails: Assuming normal distributions understates the frequency and magnitude of large losses in many asset classes.
- Neglecting inflation and real returns: Nominal averages can look acceptable while purchasing power erodes.
- Overcomplicating models: Highly parameterized systems can be fragile to input error and regime change.
- Overlooking costs and taxes: Small frictions compounded over time materially reduce net outcomes.
- Liquidity mismatch: Committing to illiquid assets without a realistic plan for cash needs can force distressed selling.
Putting the Tradeoff to Work: A Practical Framework
An analytical framework helps organize decisions without prescribing specific investments. Key elements include:
- Objectives and constraints: Define the role of the portfolio, nominal versus real goals, risk tolerances, liquidity needs, regulatory or policy limits, and time horizon.
- Return and risk assumptions: Use ranges rather than single-point estimates. Address uncertainty explicitly.
- Diversification plan: Identify asset classes and factors that are expected to provide complementary behavior across regimes.
- Risk budgeting: Set desired risk contributions by asset or factor, and monitor whether realized risk aligns with intentions.
- Scenario analysis: Test the portfolio under multiple adverse and benign environments, with attention to correlation shifts.
- Liquidity management: Map assets to liquidity tiers and align with cash flow obligations. Include a plan for stress periods.
- Governance and rebalancing: Establish clear decision rules, review cycles, and tolerance bands for drift.
This framework integrates the tradeoff into everyday portfolio governance. It does not eliminate uncertainty. It channels uncertainty into a structure that clarifies the choices being made and the risks being accepted in pursuit of long-term goals.
What History Suggests, and What It Does Not
Historical observations can calibrate expectations, but they are not promises. Over the last century in the United States, broad equities have delivered higher average nominal returns than bonds, with materially higher volatility and drawdowns. Investment-grade bonds have provided lower but steadier nominal returns, with sensitivity to interest rates and inflation surprises. Multi-asset portfolios that diversify across equities and bonds have often reduced volatility relative to equities alone, although the benefit has varied across periods, especially when inflation was volatile.
Other markets and eras show different patterns. Equity premia, bond yields, and inflation dynamics vary by geography and decade. Forward-looking planning therefore benefits from humility about the stability of relationships. The risk vs return tradeoff is structural, but the exact slopes and intercepts change through time.
Linking Tradeoffs to Resilience
Resilience is the capacity of a portfolio to withstand stress without derailing its mission. It derives from diversification, prudent risk budgeting, appropriate liquidity, and alignment with liabilities and time horizon. The risk vs return tradeoff is the foundation of resilience because it forces an explicit acknowledgment of uncertainty and cost. Every expected return target carries a price in variability, potential drawdown, and tail risk. Every reduction in risk imposes a cost in forgone upside and potentially in failing to meet real objectives.
A resilient posture does not imply perfection in every environment. It aims for robustness across a range of plausible states of the world. That is what makes the tradeoff concept central to portfolio construction and long-term capital planning.
Key Takeaways
- The risk vs return tradeoff is probabilistic and multi-dimensional, encompassing volatility, drawdowns, liquidity, and inflation effects.
- Portfolio-level outcomes depend critically on correlations, which change across regimes and can weaken diversification when stress rises.
- Long-term capital planning requires attention to real returns, sequence risk, and the compounding impact of volatility on geometric growth.
- Risk budgeting, factor mapping, and scenario analysis translate the tradeoff into practical portfolio governance without prescribing specific investments.
- Resilience comes from aligning expected returns with acceptable risks, liquidity needs, and liability characteristics, acknowledging that relationships evolve over time.