Overview
Macroeconomic indicators do not all move at the same time. Some turn before the overall economy changes direction, while others confirm what has already happened. The distinction between leading and lagging indicators is central to fundamental analysis because valuation depends on expectations about future cash flows and the discount rate applied to those cash flows. Understanding what tends to move early and what tends to move late helps analysts form disciplined views about the business environment a firm will face.
This article defines leading and lagging indicators, places them in the context of fundamental analysis, and shows how they shape long-horizon valuation work. The focus remains on macroeconomic information rather than trading rules or technical signals.
Definitions and the Logic of Timing
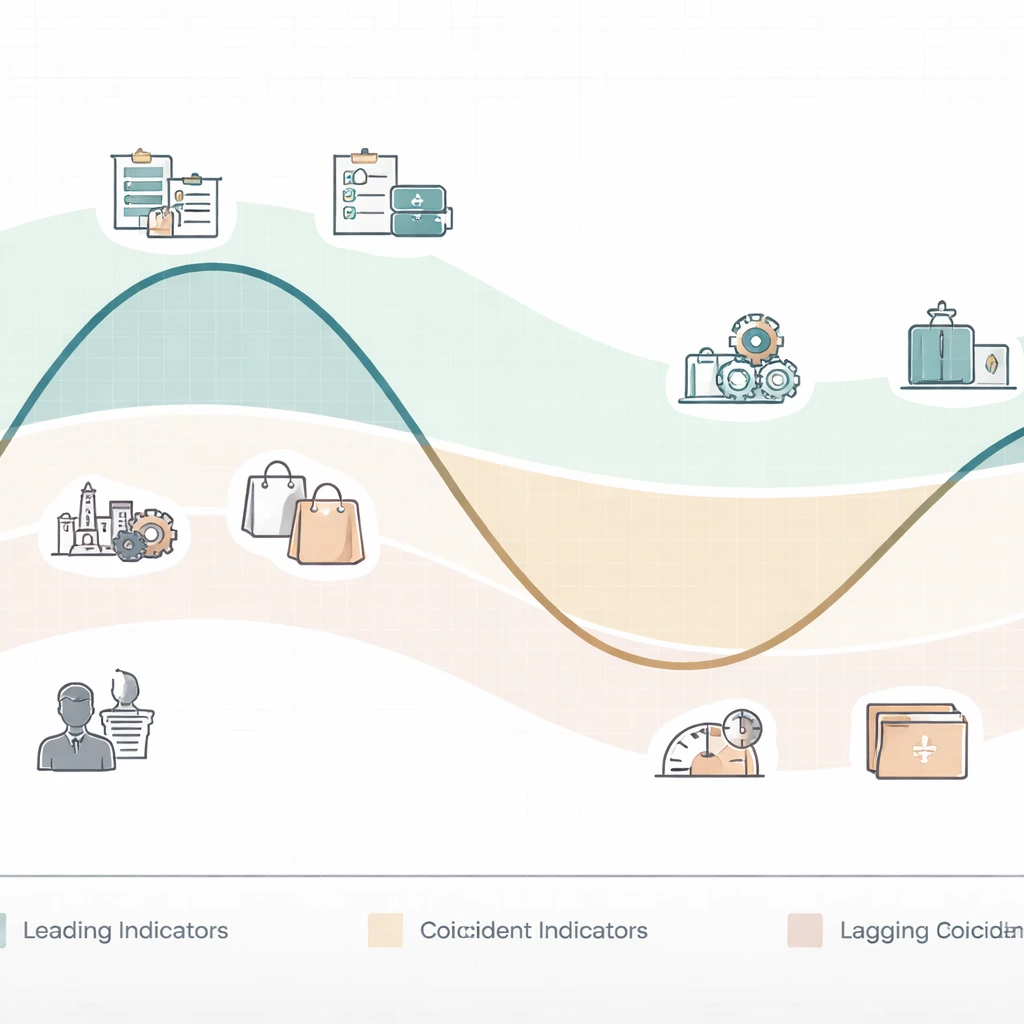
Leading indicators tend to change before the broader economy or corporate fundamentals turn. They often reflect plans, expectations, or financial conditions that influence future spending and income. Examples include new manufacturing orders, building permits, credit standards reported by banks, survey measures of business or consumer expectations, and some financial variables that embed forward-looking information, such as the slope of the yield curve or corporate credit spreads.
Coincident indicators move roughly with the economy. They include current retail sales, industrial production, and payroll employment growth at a monthly frequency. Coincident information is useful for real-time assessment of the present state, which anchors the starting point of any valuation model.
Lagging indicators follow the cycle. They confirm developments that usually began months earlier. Examples include the unemployment rate peaking after a recession, inflation easing long after demand cools, or default rates rising well after bank lending has slowed. Corporate profit data compiled from national accounts also tends to be released with delays that make it a lagging confirmation of earnings dynamics already unfolding.
The sequencing is intuitive. Plans and sentiment change first, then spending and production adjust, and finally slow-moving outcomes such as employment, inflation, and credit losses reflect the cumulative effect. Because valuation focuses on the future rather than the past, analysts weigh forward-looking signals more heavily when constructing scenarios, while relying on lagging indicators to validate or challenge those scenarios as time passes.
Why Timing Matters for Intrinsic Value
Intrinsic value is commonly framed as the present value of expected future cash flows. That expression contains two ingredients, the path of cash flows and the discount rate. Macroeconomic indicators shape both.
On the cash flow side, leading indicators provide early evidence about revenue growth, pricing power, input costs, and investment behavior. For a firm selling to cyclical end markets, a sustained decline in new orders and business expectations often precedes actual revenue weakness. For a consumer-facing firm, falling consumer confidence and tighter credit availability may lead eventual sales slowdowns. Lagging information, such as the unemployment rate, may not warn of the initial downturn but can validate the severity of the contraction once it arrives. Both help refine the trajectory used in a valuation model, but they inform different stages of the analysis.
On the discount rate side, the macro environment drives benchmark interest rates, risk premia, and financing conditions. Some financial variables incorporate expectations about policy and growth conditions and behave as leading indicators. When the term structure of interest rates inverts, it often signals tighter policy and weaker future growth, which can influence the cost of capital. Lagging indicators, such as realized default rates, reflect the consequences of earlier conditions and can affect the risk premium demanded by investors in the aftermath of a downturn. The interplay of leading and lagging information helps analysts judge where the cost of capital is headed over the horizon relevant to their valuation.
For long-term valuation work, the sequence is particularly important at turning points. Early deterioration in leading indicators may not immediately change near-term earnings, but it can change the slope of the expected cash flow path, the probability assigned to scenarios, and the sensitivity of value to discount rate assumptions. Conversely, after a recovery has begun, lagging indicators may remain weak for a time, but leading data can justify revising growth expectations upward before the lagging confirmation arrives.
Common Leading Indicators in Macroeconomic Analysis
Leading indicators share two features. They are available with relatively short publication lags, and they capture decisions taken today that influence activity tomorrow. The list below is not exhaustive and should be adapted to the sector or asset under study.
- Order flows and backlogs. New manufacturing orders and unfilled order backlogs provide direct insight into pipeline demand. Persistent declines in new orders have historically preceded slowdowns in industrial production and corporate revenues among goods producers.
- Housing activity. Building permits, housing starts, and mortgage applications often lead broader activity because residential investment is interest-rate sensitive and influences downstream demand for materials, appliances, and services.
- Surveys of expectations. Purchasing managers’ surveys, small business outlooks, and consumer expectations indexes provide early signals about planned hiring, capital expenditure, and discretionary spending. They have practical value because they capture intentions that may translate into real activity within quarters.
- Credit conditions. Bank lending standards, credit utilization, and corporate credit spreads often turn before realized defaults or loan losses. When lenders tighten standards, investment and hiring plans often soften in subsequent quarters.
- Labor market leads. Initial claims for unemployment insurance and planned hiring surveys can lead turns in employment. Although total employment is largely coincident, early layoff activity tends to increase ahead of broader labor market weakness.
- Financial market signals. The slope of the Treasury yield curve, cross-currency funding pressures, or measures of financial conditions aggregate information about policy and growth expectations. These measures are not trading indicators in this context; they are macro inputs that inform the trajectory of financing costs and investment behavior.
- Global trade and logistics. Export orders, freight rates, and supplier delivery times can lead shifts in goods-producing sectors, especially for firms embedded in global supply chains.
Each of these measures has limitations. Surveys can be influenced by sentiment shocks that do not translate into concrete action. Financial indicators can be distorted by policy interventions. Order data can be affected by cancellations or double-booking. Analysts therefore cross-check multiple leading series rather than rely on a single metric.
Common Lagging Indicators and Their Interpretive Value
Lagging indicators are not less important. They anchor the empirical record and inform how far the cycle has progressed.
- Unemployment and broader labor slack. The unemployment rate usually peaks after recessions begin. Measures of long-term unemployment and underemployment adjust even more slowly. These series help analysts gauge the depth of a downturn and the potential for wage pressures once a recovery matures.
- Inflation and wage growth. Headline and core inflation, particularly on a year-over-year basis, lag changes in demand conditions. Wage growth typically decelerates after slack increases. These data are critical when modeling input costs and pricing power, even though they confirm rather than predict the turn.
- Corporate profits in national accounts. Profits reported in macroeconomic accounts lag corporate reporting and are subject to revisions. They validate broader earnings dynamics and provide context for firm-level results.
- Credit losses and defaults. Delinquency rates, charge-offs, and bankruptcy filings rise well after credit growth slows. They shape the risk premium demanded by lenders and investors in the next phase of the cycle.
- Inventory ratios. Inventory-to-sales ratios often peak after demand has already softened. Elevated ratios can inform margin assumptions through discounting and production adjustments.
Lagging indicators are particularly useful for stress testing. When unemployment or default rates reach levels associated with past recessions, analysts can calibrate downside scenarios for revenues and margins, even if leading data already suggest that the worst is passing. In valuation terms, lagging confirmation affects the distribution of outcomes and the parameters used in discounted cash flow analysis.
Data Revisions, Measurement, and Publication Lags
Many macroeconomic series are revised as more complete information becomes available. Early estimates often rely on surveys and partial data, with comprehensive data incorporated later. This matters for fundamental analysis. An apparent stabilization in a leading index may be revised away, and a lagging measure may appear benign until revisions reveal a deeper deterioration. Analysts account for this by tracking both first releases and subsequent revisions, noting which series are historically volatile.
Publication lags differ across indicators. Some financial conditions measures are available daily, while national accounts data are quarterly with delays. Inflation is monthly, and many surveys are released within days of month end. The mixed timing implies that a coherent macro assessment requires stitching together data from different frequencies. Valuation models typically rely on quarterly or annual cash flows, so intra-quarter signals are aggregated into a quarterly profile through nowcasting or simple rules of thumb.
Seasonality and base effects also merit attention. Year-over-year inflation can move substantially because of changes a year earlier, not because of current dynamics. Some analysts prefer month-over-month or three-month annualized rates for more timely signals. For orders and production, seasonal adjustment can be imperfect around holidays or strikes. Awareness of these issues reduces the risk of misreading short-run fluctuations.
Using Indicators in Fundamental Analysis
Macroeconomic indicators inform valuation through two main channels, the forecast of cash flows and the determination of the discount rate. A structured approach helps maintain discipline.
Translating Leading Data into Revenue and Margin Assumptions
Analysts often map specific leading indicators to the revenue drivers most relevant for a firm or sector. For a capital goods manufacturer, durable goods orders and capital spending plans by businesses are more informative than consumer sentiment. For a grocery retailer, real disposable income and consumer expectations carry more weight. Once mapped, the indicators are used to tilt growth assumptions for the next several quarters.
Margins depend on both pricing power and input costs. Survey data on supplier delivery times and order backlogs can signal pressure on production capacity, which in turn may affect pricing. Commodity prices and wages feed into cost projections with lags that vary by industry. When leading cost pressures build while demand indicators soften, analysts may model a temporary squeeze in margins even if revenue continues to grow.
Anchoring with Lagging Confirmation
Lagging indicators help validate the scenario set. If the unemployment rate and default rates have risen to levels historically associated with deep downturns, revenue scenarios should be stress tested against that reality. If inflation has already decelerated significantly, cost assumptions may be revised downward even if some leading indicators are still weak. The balance between leading and lagging evidence is part of the art of valuation.
Discount Rate Inputs
The cost of capital reflects a risk-free rate and risk premia. Term structure measures, credit spreads, and broader financial conditions provide early clues about where financing costs may settle over the next year. Analysts avoid treating these as trading signals. Instead, they use them to shape the path of the discount rate in multi-period models, for example by allowing the weighted average cost of capital to drift with expected policy normalization or financial stress relief.
Scenario Design and Probabilities
Given the uncertainty inherent in macro forecasts, many valuation exercises adopt scenario analysis. Leading indicators inform the likelihood and the timing of a downturn or recovery scenario. Lagging indicators help calibrate the depth of those scenarios and the recovery dynamics. Probabilities are updated as the data evolve. This process aligns with a Bayesian approach to information, where early signals move prior expectations and late confirmations refine the posterior distribution of outcomes.
Sector-Specific Considerations
The mapping from macro indicators to firm fundamentals varies by sector.
In consumer discretionary, expectations for employment and real income growth are central. Consumer confidence and credit availability are often leading, while actual retail sales and unemployment changes are coincident or lagging. Price-sensitive categories respond quickly to changes in fuel prices and interest rates.
In industrials and materials, new orders, capacity utilization signals, and inventory cycles dominate. Global trade indicators can be leading for export-oriented firms. The inflation data that matter most are input-specific, such as metals or chemicals prices, which filter through to margins with measurable lags.
In financials, lending standards and the shape of the yield curve influence future net interest margins and loan growth. Lagging indicators like realized charge-offs and nonperforming loan ratios provide information about loss content, provisioning needs, and capital requirements long after the initial tightening in credit conditions.
In real estate, building permits and mortgage application activity lead price and rent dynamics in many markets, while vacancy rates and rent growth commonly lag. For real estate investment trusts, the interaction of financing costs and occupancy trends is central to valuation.
Global firms face an additional layer. Leading indicators must be collected across key end markets, and currency conditions and external demand indicators become particularly relevant. Synchronization or divergence across regions can amplify or dampen company-level exposure.
Case Context: A Manufacturing Firm Through a Cycle
Consider a hypothetical mid-cap manufacturer of industrial components with sales concentrated in heavy machinery and construction equipment. The firm operates with a moderate backlog and sells globally. The task is to assess how the valuation profile might evolve over a two-year horizon using macro indicators rather than company guidance alone.
Early in the year, surveys of purchasing managers show a sustained decline in new orders and a drop in the new-orders-to-inventories ratio. Bank lending surveys indicate tighter credit to firms, especially for capital expenditure. Building permits weaken in several major markets, and the slope of the yield curve flattens. Revenues and margins have not yet changed materially, and the firm reports that its backlog remains near a record high.
From a fundamental perspective, the leading data suggest a slowing activity environment with a lag between order deterioration and realized revenue. The analyst reduces the outer-quarter revenue growth assumptions, keeping the near-term quarter relatively stable given the backlog. Input cost pressures, as reflected in supplier delivery times and commodity prices, have eased slightly, pointing to potential margin stabilization despite slower demand.
As quarters pass, coincident indicators confirm slower industrial production. The firm reports a small decline in shipments, and the backlog begins to shrink. The unemployment rate remains low initially, but initial claims have risen modestly. Later, the unemployment rate increases, confirming a broad softening. Inflation decelerates with a lag, reducing the growth rate of input costs. Credit spreads, which had widened earlier, begin to narrow as policy expectations change.
Throughout this period, the valuation model evolves. Early signals from leading indicators shaped the trajectory of expected cash flows, pushing the inflection point forward even while reported results looked resilient. Lagging confirmation allowed the analyst to calibrate the depth of the downturn and adjust the cost of capital as financial conditions eased. By the time lagging indicators turned, the forward-looking assumptions had already incorporated a recovery path based on improving orders and financial conditions.
This example illustrates how the sequence of information can be integrated into a coherent valuation process without relying on short-term trading cues. Leading data guided expectations. Lagging data provided validation and helped anchor risk parameters.
Policy Regimes and Structural Considerations
Policy choices and structural features of the economy influence both the behavior of indicators and the translation from macro signals to firm fundamentals.
Monetary policy operates with variable lags. When central banks tighten policy, interest-sensitive sectors such as housing and durable goods typically slow first, and those slowdowns are captured by leading measures like mortgage applications and order surveys. Employment and inflation respond later. For valuation, this means that early policy-driven signals can justify adjusting the path of cash flows and the discount rate before lagging outcomes confirm the change.
Fiscal policy can affect the ordering of indicators. Temporary tax incentives for capital expenditure may produce a leading spike in orders and shipments that is not sustained once the incentive expires. Infrastructure programs can support construction and materials demand even when other sectors weaken. Analysts consider these policy distortions when interpreting both leading and lagging data.
Structural shifts, such as changes in global supply chains, energy transitions, or demographic trends, can alter historical relationships between indicators and outcomes. For example, a sustained shift to remote work can change the link between office construction permits and broader service-sector growth. When structural breaks occur, composite indicator frameworks built on past relationships may have less predictive content, and analysts may need to rely more on sector-specific micro data.
Composite Indexes and Cross-Checks
To manage noise and measurement error, institutions often publish composite leading indexes and coincident indexes. These aggregates reduce the risk that a single series yields a false signal. For fundamental analysis, composite indexes provide a first-pass view of the direction and broad momentum of the economy, which can be combined with sector-level indicators for a more targeted assessment.
Cross-checking across domains is also valuable. If leading surveys deteriorate but financial conditions remain loose, the tension warrants caution in adjusting valuations. Similarly, if leading series improve while credit spreads remain wide, discount rate assumptions may retain a conservative tilt. The objective is coherence, not precision in timing.
Common Pitfalls
Several errors recur when incorporating macro indicators into valuation work.
- Overreliance on a single indicator. No single measure defines the cycle. A balanced set that includes orders, credit, housing, and sentiment provides broader coverage.
- Ignoring revisions. Early strength or weakness can be revised away. A robust process tracks vintage data and evaluates stability over time.
- Confusing levels and rates of change. Many indicators are most informative in their rate of change. A high level of spending growth that is decelerating can matter more for margins than the level itself.
- Misreading base effects. Year-over-year inflation or growth can shift because of the comparison period rather than current momentum.
- Extrapolating relationships across regimes. Historical correlations can break when policy regimes or structural conditions change. Prior cycles are a guide, not a rule.
A Practical Framework for Analysts
The following steps outline a disciplined approach to integrating leading and lagging indicators into fundamental analysis for long-term valuation.
- Define the economic exposures that drive the firm’s revenues and costs, distinguishing between domestic and external demand, goods and services, and the sensitivity to interest rates and credit conditions.
- Select a small set of leading indicators mapped to those exposures, such as orders, housing permits, or sector-specific surveys, and complement them with broad financial conditions measures.
- Track coincident indicators to anchor the present state, ensuring that the starting point of the valuation model reflects current activity rather than last quarter’s results alone.
- Use lagging indicators for calibration and stress testing, especially for labor market slack, inflation pressure, and credit losses that influence margins and risk premia.
- Translate indicator movements into cash flow paths, noting the typical lags observed in the sector, and adjust the discount rate path to reflect changes in financial conditions.
- Adopt scenario analysis, update probabilities as new data arrives, and document how revisions and data surprises change assumptions rather than reacting to each data point in isolation.
Real-World Context
Recent decades provide multiple episodes where the distinction between leading and lagging indicators proved consequential for valuation. Ahead of several modern slowdowns, survey measures of new orders, housing permits, and bank lending standards softened months before unemployment rose. Equity analysts who considered the leading weakness adjusted revenue growth trajectories earlier than those who relied on lagging confirmation.
The pandemic shock showed the value and limitations of indicator timing. Some leading surveys collapsed rapidly, coincident activity fell sharply, and certain lagging measures like unemployment surged with less delay than in typical recessions due to the abrupt nature of the shock. The episode highlighted that the identity of leading and lagging indicators can compress when shocks are extreme, and that policy responses can alter normal lags. For valuation work, that meant model parameters needed to allow for unusual speed in both downturn and recovery phases.
More recently, surges in inflation and shifts in policy tightened financial conditions before inflation itself began to decline. Forward-looking measures, including term structure and credit spreads, signaled expectations of slower growth. Lagging inflation data continued to show elevated readings for several months. Analysts modeling margins and discount rates benefited from distinguishing between these temporal layers rather than relying on a single aggregate measure.
Why the Concept Matters for Long-Horizon Valuation
Valuation is a forward-looking exercise that must be grounded in reality. Leading indicators provide the forward link to changes in demand and financing conditions that drive revenues and costs. Lagging indicators provide the backward link that validates or challenges the narrative and ensures that the model remains tethered to observed outcomes. Long-horizon assessments benefit from both, because the weight placed on the future must be balanced by the evidence of what has actually occurred.
Moreover, the concept guards against common behavioral pitfalls. When recent results look strong, lagging confirmation can create a false sense of security if leading data are deteriorating. Conversely, when lagging data still look weak, leading improvement can help avoid extrapolating the worst phase of the cycle too far into the future. Maintaining the distinction encourages a structured, transparent approach to updating assumptions.
Key Takeaways
- Leading indicators move before the broader economy and help shape expectations for cash flows and discount rates, while lagging indicators confirm outcomes after the fact.
- Valuation benefits from integrating both, using leading data to adjust trajectories and lagging data to calibrate depth and validate scenarios.
- Sector context matters, since the most informative indicators differ across consumer, industrial, financial, and real estate exposures.
- Data revisions, publication lags, and policy regimes can alter relationships, so cross-checking multiple indicators and monitoring revisions is essential.
- A disciplined framework links indicators to revenue, margin, and discount rate assumptions, avoiding reliance on any single series or trading-oriented signal.