Introduction
Business cycles describe the recurring expansions and contractions in aggregate economic activity over time. They are not mechanical or perfectly periodic, and they differ in length and intensity across countries and eras. Yet they remain central to fundamental analysis because they shape two pillars of intrinsic value: expected cash flows and the discount rates used to value those cash flows. An asset that appears attractively priced at the peak of an expansion can be less compelling once one accounts for cyclically elevated margins, tight credit conditions, or changes in risk premiums. Conversely, cyclically depressed earnings in a recession may obscure resilient long-run economics.
This article defines business cycles, explains how they enter valuation, and shows how a cycle-aware framework clarifies the link between macro conditions and intrinsic value across equities, credit, real estate, and commodities. The emphasis is on economic mechanisms rather than timing or prediction.
What Is a Business Cycle?
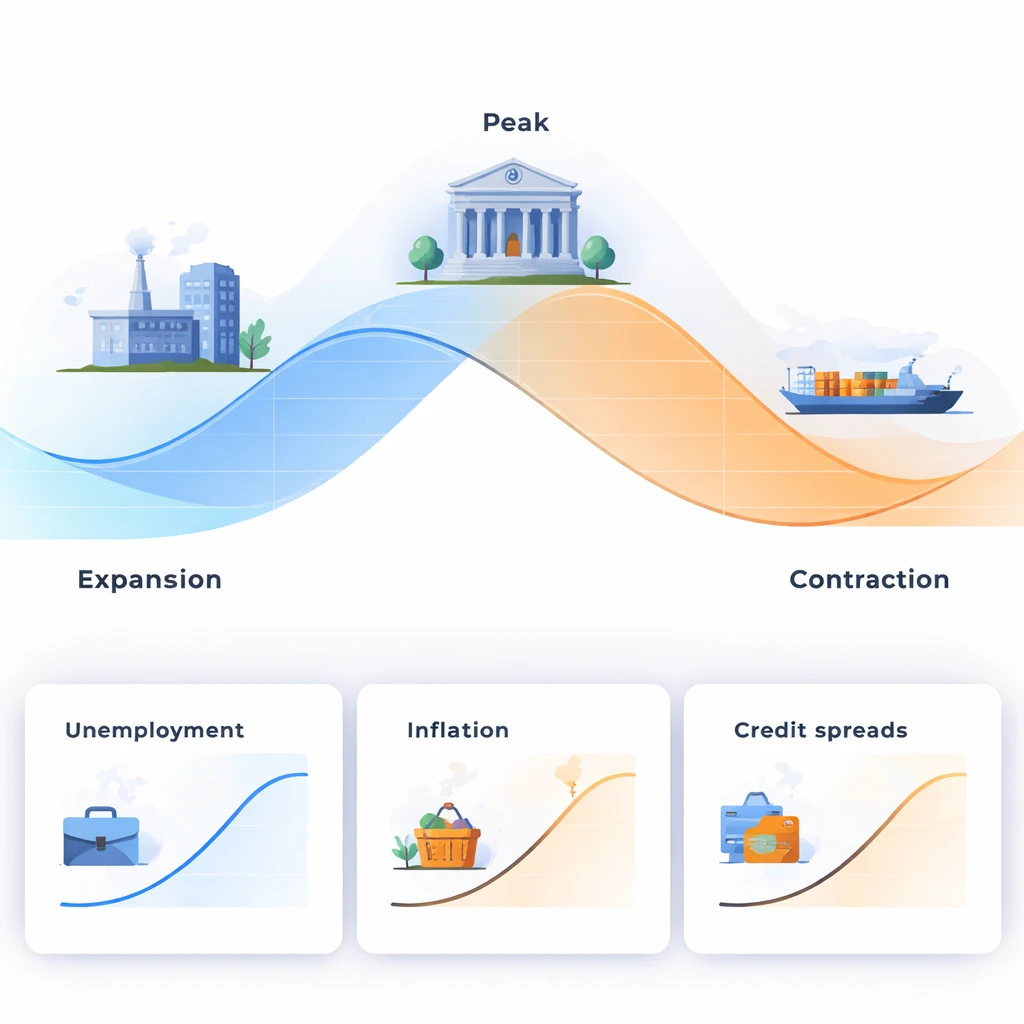
A business cycle is a broad-based fluctuation in economic activity that spans production, income, employment, and spending. It is typically characterized by four phases: expansion, peak, contraction, and trough. Expansions feature rising output, improving labor markets, and generally stable financial conditions. Peaks mark the point at which growth slows and imbalances accumulate. Contractions involve declining or stagnating output, weakening labor markets, and tighter financial conditions. Troughs represent the turning point from contraction back to expansion.
Cycle dating in practice depends on institutions and methods. In the United States, the National Bureau of Economic Research identifies turning points by evaluating a range of monthly and quarterly indicators, including real income, employment, industrial production, and sales. Cycle phases do not have fixed lengths. Some expansions last a few years; others can extend for a decade. Contractions have historically been shorter, but their severity varies widely.
Phases and Dynamics
Expansion. Firms increase production to meet demand, hiring rises, and capacity utilization climbs. Credit is available, risk appetite is stronger, and investment accelerates. Profits often improve as operating leverage works in favor of firms with relatively fixed costs. Late in expansions, cost pressures from tight labor and input markets can compress margins if pricing power is weak.
Peak. Growth slows as capacity constraints, rising costs, or policy tightening build. Earnings growth decelerates. Financial vulnerabilities that accumulated during the expansion, such as higher leverage or misaligned maturities, become more visible.
Contraction. Spending eases, production is cut, and inventories are reduced. Employment weakens and credit conditions tighten. Firms with limited liquidity or high leverage face refinancing challenges. Profit margins compress, and defaults rise in weaker credit cohorts.
Trough. Stabilization begins. Inventory drawdowns end, policy may become more supportive, and forward-looking indicators improve. The early recovery often shows pronounced gains in cyclically sensitive sectors as slack allows production to increase without immediate bottlenecks.
How Business Cycles Are Measured
Analysts track the cycle using macroeconomic and financial data rather than a single statistic:
- Output and income: Real GDP growth, gross domestic income, and industrial production provide a broad view of activity.
- Labor markets: Nonfarm payrolls, unemployment, labor force participation, wage growth, and hours worked show the degree of slack or tightness.
- Spending and orders: Retail sales, durable goods orders, and new orders components in business surveys reveal demand momentum.
- Prices and costs: Headline and core inflation, producer prices, and commodity costs illuminate cost pressures and pricing power.
- Surveys: Purchasing Managers’ Indexes and similar diffusion indices summarize broad conditions for output, new orders, and employment.
- Financial conditions: Credit growth, lending standards, corporate bond spreads, equity issuance, and measures of liquidity help assess financing availability.
Cycle assessment benefits from triangulating multiple indicators to avoid overreliance on a single volatile series or one that is subject to large revisions.
Why Business Cycles Matter for Intrinsic Value
Intrinsic value reflects the present value of expected cash flows discounted at a required rate of return. Business cycles influence both parts of this equation. They affect the level, timing, and volatility of cash flows, and they shift discount rates via risk-free rates, term premiums, credit spreads, and equity risk premiums.
Cash Flow Sensitivity
Revenue growth. Aggregate demand strengthens in expansions and weakens in contractions. Sales for cyclical industries such as autos, semiconductors, capital goods, and retail often fluctuate more than GDP. Defensive categories such as basic consumer staples exhibit smaller swings.
Margins and operating leverage. When fixed costs are significant, small changes in revenue can produce large changes in operating income. Late-cycle cost pressures from wages, freight, or key inputs can compress margins if pricing power is limited. During contractions, firms may reduce discretionary expenses, but margin erosion can still be substantial as volumes fall.
Investment and working capital. Capital expenditures and inventories tend to be procyclical. Early in recoveries, firms rebuild inventories and may outlay cash for growth projects. In downturns, they defer investment and run down inventories to preserve liquidity. These adjustments change free cash flow timing even when long-run prospects are intact.
Credit losses and defaults. For lenders, credit costs rise during contractions as borrower finances deteriorate. Expected losses and loan loss provisions absorb income. For nonfinancials, debt service and refinancing risk can strain cash flows when revenues decline and spreads widen.
Discount Rates and Risk Premia
Risk-free rates. Central banks adjust policy rates in response to inflation and activity. Real and nominal yields embedded in government bonds flow through to discount rates for other assets. Policy tightening in late expansions raises financing costs and can lower present values even before cash flows soften.
Term premium and curve shape. The term premium and the configuration of the yield curve shift across the cycle. Curve flattening or inversion often accompanies late-cycle conditions when policy rates rise and growth expectations moderate. These dynamics influence the discounting of distant cash flows relative to near-term cash flows.
Credit spreads and equity risk premium. Risk appetite varies with the cycle. Spreads usually compress in expansions and widen in contractions. The required return on risky cash flows rises as uncertainty increases, lowering valuations even if current earnings have not yet changed.
Survivorship and Optionality
Contractions test business models. The capacity to fund operations through a downturn has option-like value. Firms with resilient balance sheets often can invest when assets are cheaper and competitors are constrained. The market tends to recognize this resilience through cycle-differentiated discount rates and valuation multiples.
Using Business Cycles in Fundamental Analysis
Cycle-aware analysis does not aim to predict turning points with precision. It seeks to ensure that valuation inputs are consistent with the phase of the cycle and with plausible paths for growth, margins, and financing conditions. Several practices help align models with macro reality.
Normalizing Earnings and Margins
Point-in-time profitability can be misleading at both extremes of the cycle. Normalizing involves estimating sustainable margins and earnings across a typical cycle given industry structure, cost curves, and pricing power. Analysts often adjust for unusually high or low commodity prices, temporary cost shocks, or transient demand surges. Cyclically adjusted metrics reduce the risk of capitalizing peak profits or extrapolating trough conditions.
Scenario Analysis and Sensitivity
Scenario analysis builds a base case, a downside case, and an upside case that reflect different macro paths. A downside case might include a mild contraction with declining volumes, modest margin compression, and wider credit spreads. An upside case might involve a durable expansion with stable margins and benign financing conditions. Sensitivity analysis around key macro drivers such as wage growth, input costs, or policy rates clarifies which assumptions matter most for intrinsic value.
Cost of Capital Across the Cycle
The weighted average cost of capital should reflect risk-free rates, credit spreads, and the equity risk premium appropriate for the cycle. In a late expansion with tighter policy and elevated spreads, a higher discount rate may be warranted relative to an early expansion with easier financial conditions. Using a single static discount rate irrespective of the environment can distort intrinsic value estimates.
Separating Cyclical and Structural Forces
Not all growth is cyclical. Demographics, technology, regulation, and market structure shape long-run trajectories. A cycle-aware fundamental analysis distinguishes between temporary deviations from trend and structural shifts. For example, a temporary supply shock that raises input costs should be analyzed differently from a structural rise in industry concentration that durably improves pricing power.
Cross-Sector and Asset Class Cyclicality
Cyclicality is heterogeneous. Understanding how different assets transmit the business cycle into cash flows and discount rates improves comparability and model calibration.
Equities
Within equities, sectors differ in their exposure to the cycle. Cyclical sectors such as industrials, consumer discretionary, and materials experience larger swings in volumes and margins. Defensive sectors such as utilities and consumer staples tend to show more stable cash flows. Technology varies by subsector, with semiconductors and hardware often more cyclical than software with subscription revenues. Valuation frameworks benefit from segment-level analysis of revenue sensitivity, fixed cost intensity, and pricing power.
Corporate Credit
Credit analysis is explicitly cycle-sensitive. Default risk and recovery values worsen in contractions. Interest coverage, maturity ladders, covenant protections, and access to capital markets matter most when conditions deteriorate. Spreads compress in expansions and widen in downturns, affecting total returns even if issuers avoid default. For high yield, the distribution of outcomes is heavily influenced by sector mix and refinancing windows.
Real Estate
Commercial real estate links the cycle to rent growth, occupancy, and cap rates. In expansions, absorption improves and rents rise. In contractions, vacancies rise and landlords offer concessions. Financing costs and cap rate movements directly affect valuations. Sectoral differences are large: lodging is highly cyclical, while some residential and logistics categories can be less volatile depending on local supply constraints.
Commodities
Commodity cycles reflect both demand and supply dynamics. Inventory levels, marginal production costs, investment cycles, and geopolitics interact with macro conditions. For extractive industries, long lead times and capital intensity can produce prolonged periods of over or under supply. Fundamental valuation often centers on the sustainable price relative to the marginal cost of production across the cycle.
Policy and External Shocks
Policy choices shape the cycle. Monetary policy influences short-term rates, financial conditions, and ultimately demand. Fiscal policy affects aggregate demand directly through spending and indirectly through transfers and taxes. Regulatory changes can alter credit formation or industry dynamics.
External shocks perturb the cycle. Energy price spikes, pandemics, geopolitical conflicts, and natural disasters move demand and supply in ways that can change both the level and the composition of activity. The propagation of shocks depends on balance sheets, policy responses, and institutional resilience.
Global Dimensions of Business Cycles
Business cycles are increasingly interconnected but not perfectly synchronized. Trade linkages, financial integration, and currency regimes transmit shocks across borders with lags and amplification. A multinational’s cash flows depend on the distribution of its revenue and cost base across economies that may be at different points in the cycle. Currency movements change translated earnings and balance sheet ratios. Differences in policy regimes and inflation histories also imply different sensitivities of discount rates to the cycle across countries.
Real-World Illustrations
Global Financial Crisis (2008 to 2009)
Before the crisis, credit expansion supported housing and consumption. Leverage built up in household balance sheets and parts of the financial system. As defaults rose in subprime mortgages, funding strains spread through securitized markets and bank balance sheets. The contraction that followed saw sharp declines in output, employment, and trade. Corporate revenues fell, margins compressed, and credit spreads widened significantly.
From a fundamental perspective, several mechanisms were evident. Cash flows fell due to weak demand and inventory correction. Discount rates rose because risk-free rates were volatile and spreads widened. Some firms faced dilutive equity issuance or distressed asset sales to stabilize balance sheets. Valuation models that used mid-cycle margins and a static cost of capital would have overstated intrinsic values during the downturn. Conversely, models that differentiated firms by liquidity, maturity profiles, and cost flexibility better captured which businesses could sustain operations and invest in recovery.
Pandemic Shock and Recovery (2020 and after)
The pandemic triggered a contraction that differed from historical recessions. Demand for contact-intensive services collapsed, while demand for durable goods and digital services rose. Fiscal and monetary policy support stabilized incomes and credit. Supply chains were disrupted, and later rapid reopening created bottlenecks and inflation pressures.
Fundamental implications were heterogeneous. Some sectors experienced record-high utilization and pricing power, while others faced prolonged weakness. Cash flow timing changed dramatically, with working capital swings driven by logistics and inventory management. Discount rates fell sharply early in the crisis as policy eased, then rose as inflation persisted and policy rates increased. Cycle-aware models that separated temporary pandemic distortions from durable changes in behavior were better suited to estimating intrinsic value.
Commodity Investment Cycle in Energy
The energy sector illustrates how supply investment interacts with demand cycles. After the shale expansion, oil prices fell sharply in 2014 to 2016. Capital expenditures were cut, and marginal supply exited. As demand recovered and investment remained constrained, prices rose and cash flows improved. For valuation, the key was distinguishing cyclical price spikes from sustainable levels relative to industry cost curves and expected long-run demand. Overcapitalization in booms and underinvestment in busts can both mislead valuations if not normalized across the cycle.
Practical Indicators to Frame Cycle Risk
Fundamental analysts often track a compact set of indicators to ground assumptions without aiming at precise timing. The following are widely used to frame cycle risk:
- Labor market breadth: Job growth across sectors, unemployment, wage dynamics, and quits rates signal slack or overheating. Tight labor markets can foreshadow margin pressure for labor-intensive industries.
- Business sentiment and orders: New orders, backlogs, and supplier delivery times indicate demand momentum and bottlenecks.
- Inventory dynamics: Inventory-to-sales ratios and inventory intentions help anticipate production adjustments that influence revenue and working capital.
- Credit conditions: Lending standards, loan growth, corporate bond issuance, and spreads inform financing availability and the cost of capital.
- Inflation trends and input costs: Core inflation, energy prices, and key commodities shape pricing power and cost trajectories.
- Policy stance: The policy rate path, balance sheet policies, and fiscal plans provide context for discount rate assumptions and demand support.
No single indicator is definitive. Coherent analysis weighs the joint evidence, its reliability, and its historical relationship to the cash flows being modeled.
Limits and Pitfalls in Cycle Analysis
Cycle analysis is informative but imperfect. Several cautions help avoid overconfidence:
Structural change. Industry structure evolves. New entrants, technology, and regulation can shift the relationship between GDP and sectoral earnings. Historical cyclicality may not hold when cost structures and competitive dynamics change.
Data revisions and measurement error. Economic data are revised, sometimes materially. Early estimates can misstate turning points. Using a range of sources and acknowledging uncertainty improves robustness.
Nonlinearities and thresholds. Relationships are not always smooth. When capacity constraints bind or credit markets freeze, small shocks can have outsized effects. Linear models can understate tail risk.
Policy regime shifts. The transmission of policy to activity and inflation varies with credibility, balance sheets, and expectations. The same policy move can have different effects across cycles.
Behavioral dynamics. Herding, extrapolation, and loss aversion can amplify cycles in markets and in corporate decision making. These dynamics affect both cash flows and discount rates and complicate inference from past patterns.
Incorporating Cycle Awareness into Valuation Models
Intrinsic value models benefit from explicit links to the cycle while avoiding unnecessary complexity. Several practical steps reflect good discipline:
Use mid-cycle or through-cycle inputs where appropriate. For sectors with pronounced cyclicality, adopt sustainable margins and volumes that reflect typical operating conditions rather than peak or trough values. Document the basis for normalization using multi-year histories, cost curves, or structural insights.
Model timing explicitly. Consider the path of cash flows across early, mid, and late cycle environments. Early recovery may show rapid revenue growth and favorable working capital swings. Late-cycle conditions may feature slower growth, wage pressure, and higher financing costs. Allow the discount rate to vary with plausible paths for policy and risk premiums.
Stress test both cash flows and discount rates. Combine downside assumptions for revenue and margin with wider spreads or higher equity risk premiums to capture the co-movement observed in contractions. Conversely, allow for benign combinations in favorable environments without assuming permanence.
Calibrate to balance sheet resilience. Differentiate firms by liquidity, debt maturities, covenants, and access to capital. Survival through a contraction supports optionality in recovery. This should be reflected in cash flow continuity assumptions and in the required return.
Be careful with terminal values. Terminal growth and normalized margins should align with long-run macro constraints such as potential GDP growth, inflation anchoring, and competitive equilibrium. Terminal discount rates should reflect long-run real rates and risk premiums rather than current cyclical extremes.
Why the Concept Matters for Long-Term Valuation
Over long horizons, valuation errors often arise from two sources: capitalizing temporary conditions and misestimating the cost of capital. Business cycle analysis mitigates both. It provides a disciplined way to interpret current profitability and financing conditions without extrapolating recent extremes. It also foregrounds the joint movement of cash flows and discount rates that can dominate valuation over multi-year horizons.
The concept is equally relevant for assets beyond common equity. In credit, cycle-aware analysis informs expected loss, recovery, and spread assumptions. In real estate, it informs sustainable rent and cap rate levels. In commodities, it tempers extrapolation of price spikes and slumps by focusing on costs and investment cycles. Across all cases, the aim is not to forecast exact turning points but to anchor valuation in plausible through-cycle economics.
Putting the Framework to Work: A Market Context Example
Consider a diversified manufacturer with a global footprint. During an expansion, orders rise, capacity utilization approaches its limit, and margins expand as fixed costs are spread over more units. The company invests in new capacity and increases inventories to meet demand. Financing costs are modest because policy rates are low and credit spreads are narrow. A discounted cash flow model built at this point that assumes current margins persist and that discount rates remain low would produce a high intrinsic value estimate.
A cycle-aware analyst would adjust. Margins would be normalized based on mid-cycle utilization and historical price-cost dynamics. Investment needs would be modeled to include the cash outflows required to expand capacity, and then the diminished growth as the cycle matures. The discount rate would incorporate the possibility of higher risk-free rates and wider spreads if policy tightens. In the downside scenario, the model would include a contraction in orders, inventory correction, and temporary negative working capital impacts. Such modeling does not prescribe a trade. It clarifies how sensitive intrinsic value is to cycle assumptions and where the balance sheet provides resilience.
Conclusion
Business cycles are a pervasive feature of market economies. They do not follow a clock, but they reliably shape revenues, margins, investment, financing conditions, and required returns. Fundamental analysis that is attentive to the cycle can better distinguish temporary conditions from durable economics and can align valuation inputs with realistic macro contexts. The goal is internal consistency and resilience of estimates rather than precision about dates or turning points.
Key Takeaways
- Business cycles are broad fluctuations in activity that influence both cash flows and discount rates, the two pillars of intrinsic value.
- Cycle-aware valuation normalizes earnings and margins, varies discount rates with financial conditions, and models cash flow timing explicitly.
- Indicators such as labor market breadth, orders, inventories, credit conditions, inflation trends, and policy stance help frame cycle risk without relying on a single metric.
- Cyclicality differs by sector and asset class, so analysis must account for industry structure, cost curves, and balance sheet resilience.
- Real-world episodes show that discount rates and cash flows often move together, making cycle recognition essential for long-horizon valuation discipline.